

As the largest public development institution in the world, the World Bank Group plays a vital role in promoting equality and helping countries in need. I worked with the WBG’s International Benchmarking Network (IBNET), whose objective is to equip water utility organizations and governments with data to promote best practices around the world.
IBNET relies on user uploaded data to operate, but has seen a sharp decline in submission over the past 5 years.
I led IBNET through full discovery and UX for their database redesign, supporting the goal of increasing overall data submission and digital presence.
Role
Lead UX Strategist
Type
Redesign, User Research, Data Visualization, Taxonomy, Information Architecture, Wireframing
Tools
Google Analytics, Adobe XD, Slickplan, Screaming Frog, Miro, Crazy Egg, Wordpress, Tableau
Duration
September 2021 — February 2022
Process

Screenshots from ib-net.org before the redesign:


Kickoff
After reading through the statement of work (SOW) and getting acquainted with the client’s existing website, I set up and facilitated a two hour interactive kickoff workshop with key project stakeholders from the World Bank Group.
During the initial kickoff, the IBNET team informed us that IBNET had experienced a severe decline in usage over the past 5 years, which they hoped to resolve with a freshened up, user friendly interface.
Digging deeper in conversation through workshop activities, it became clear that the problem IBNET faced was far more extensive than simply the UI of their website, though the root of user decline was not entirely clear.
“The problem IBNET faced was far more extensive than simply the UI of their website.”
Above are the exported Miro boards from the interactive kickoff I prepared and facilitated, showcasing goal setting and persona building activities.
Discovery
Without a full understanding of the problems behind IBNET’s user decline, I had to bolster up my exploratory research. I structured a thorough discovery process, aiming to uncover the full picture of why IBNET usage had drastically declined over the past 5 years.
Analytics Audit:
I utilized Google Analytics to analyze key awareness and engagement metrics for IBNET’s website over the past 12 months, identifying trends and looking closer at the decline in usage.
The client also provided access to their internal site visitor data, so I aggregated the two sources of site data to formulate my insights.
Heat and Scroll Map Analysis:
I used Crazy Egg to generate heat and scroll maps for IBNET’s five most trafficked pages. After collecting data for two weeks, I analyzed how users were interacting with the pages, looking closely at where they clicked and scrolled.
I found that-
Nearly half of all clicks from the homepage were to the benchmarking database.
No one is interacting with the news section, perhaps because it’s dated 2017.
The toolkit heat map shows that users are primarily staying above the fold of the page and are using it to download either the benchmarking or tariff toolkit, though the two CTA’s are not visually distinguished.
Competitor Analysis:
Though IBNET has no direct competitors, as it is the only tool of it’s kind, I found 3 comparators to evaluate on site structure and design. I evaluated AquaRating, The Organization for Economic Co-operation and Development (OECD), and The Association of Water and Sanitation Regulators of the Americas (ADERASA).
Providing a clear overview of similar tools available in the market helped stimulate conversation about the future of IBNET, while positioning their relaunch for greater success by following industry specific design standards.
Stakeholder Interviews:
I facilitated eight 45 minute interviews with users from all four user groups (water utilities, regulators, the World Bank Group, and the IBNET team). Interviewees were located across the globe, from Zambia, Palestine, the Philippines, Kenya and beyond.
During interviews I dug deeper into why users stopped using IBNET and asked what they would like to get out of the new IBNET.


User Research Survey:
I sent out a survey asking users about their experience with the existing IBNET. The survey asked users to report things like what user group they belong to, what use the site for, how they search for data, their experience uploading data, and what they need from the new IBNET.
Key Findings
After analyzing both the qualitative and the quantitative research from the discovery process, I was able to formulate key findings and present them to the IBNET team as a part of the discovery findings presentation.
IBNET’s value is not clear to users, especially those who hold the data.
This contributes to the overarching problem we are trying to solve: low and inconsistent data submission.
It’s a catch 22: IBNET is as valuable as the data it contains, but cannot obtain data without providing value to users.
Users don’t trust the quality of IBNET’s data anymore.
Due to low and inconsistent data submission, users do not trust the quality of IBNET’s data anymore and are not using it as much. IBNET’s reputation is diminishing.
The data submission process is arduous.
Users must download, fill in, and upload an excel template to submit their data to IBNET. The extensive amount of required data indicator fields also increases the complexity of the process, deterring users.
Users want to come to IBNET for guidance to improve their data and performance.
Users want more than just data from IBNET.
They want guidance on best practices and to learn about new methodologies to improve their performance and datasets, as well as their data collection processes.
Users want opportunities to connect with others in the field.
The site lacks a way for users to connect with other water practitioners, institutions, and firms.
Creating a place of convergence for the water and sanitation sector is the first step to provide value to users.
Users have trouble navigating the site and finding what they need.
Not only are users not finding what they need, but some aren’t finding what we need them to find- data submission.
Some utilities didn't even think to submit data to IBNET, nor did they know they could. We had a user say "I assumed they were getting their data automatically from somewhere, it didn’t cross my mind to submit.”
Users are proud to be affiliated with IBNET and the World Bank.
Saying their data is published with the World Bank increases an association’s credibility and gives them bragging rights!
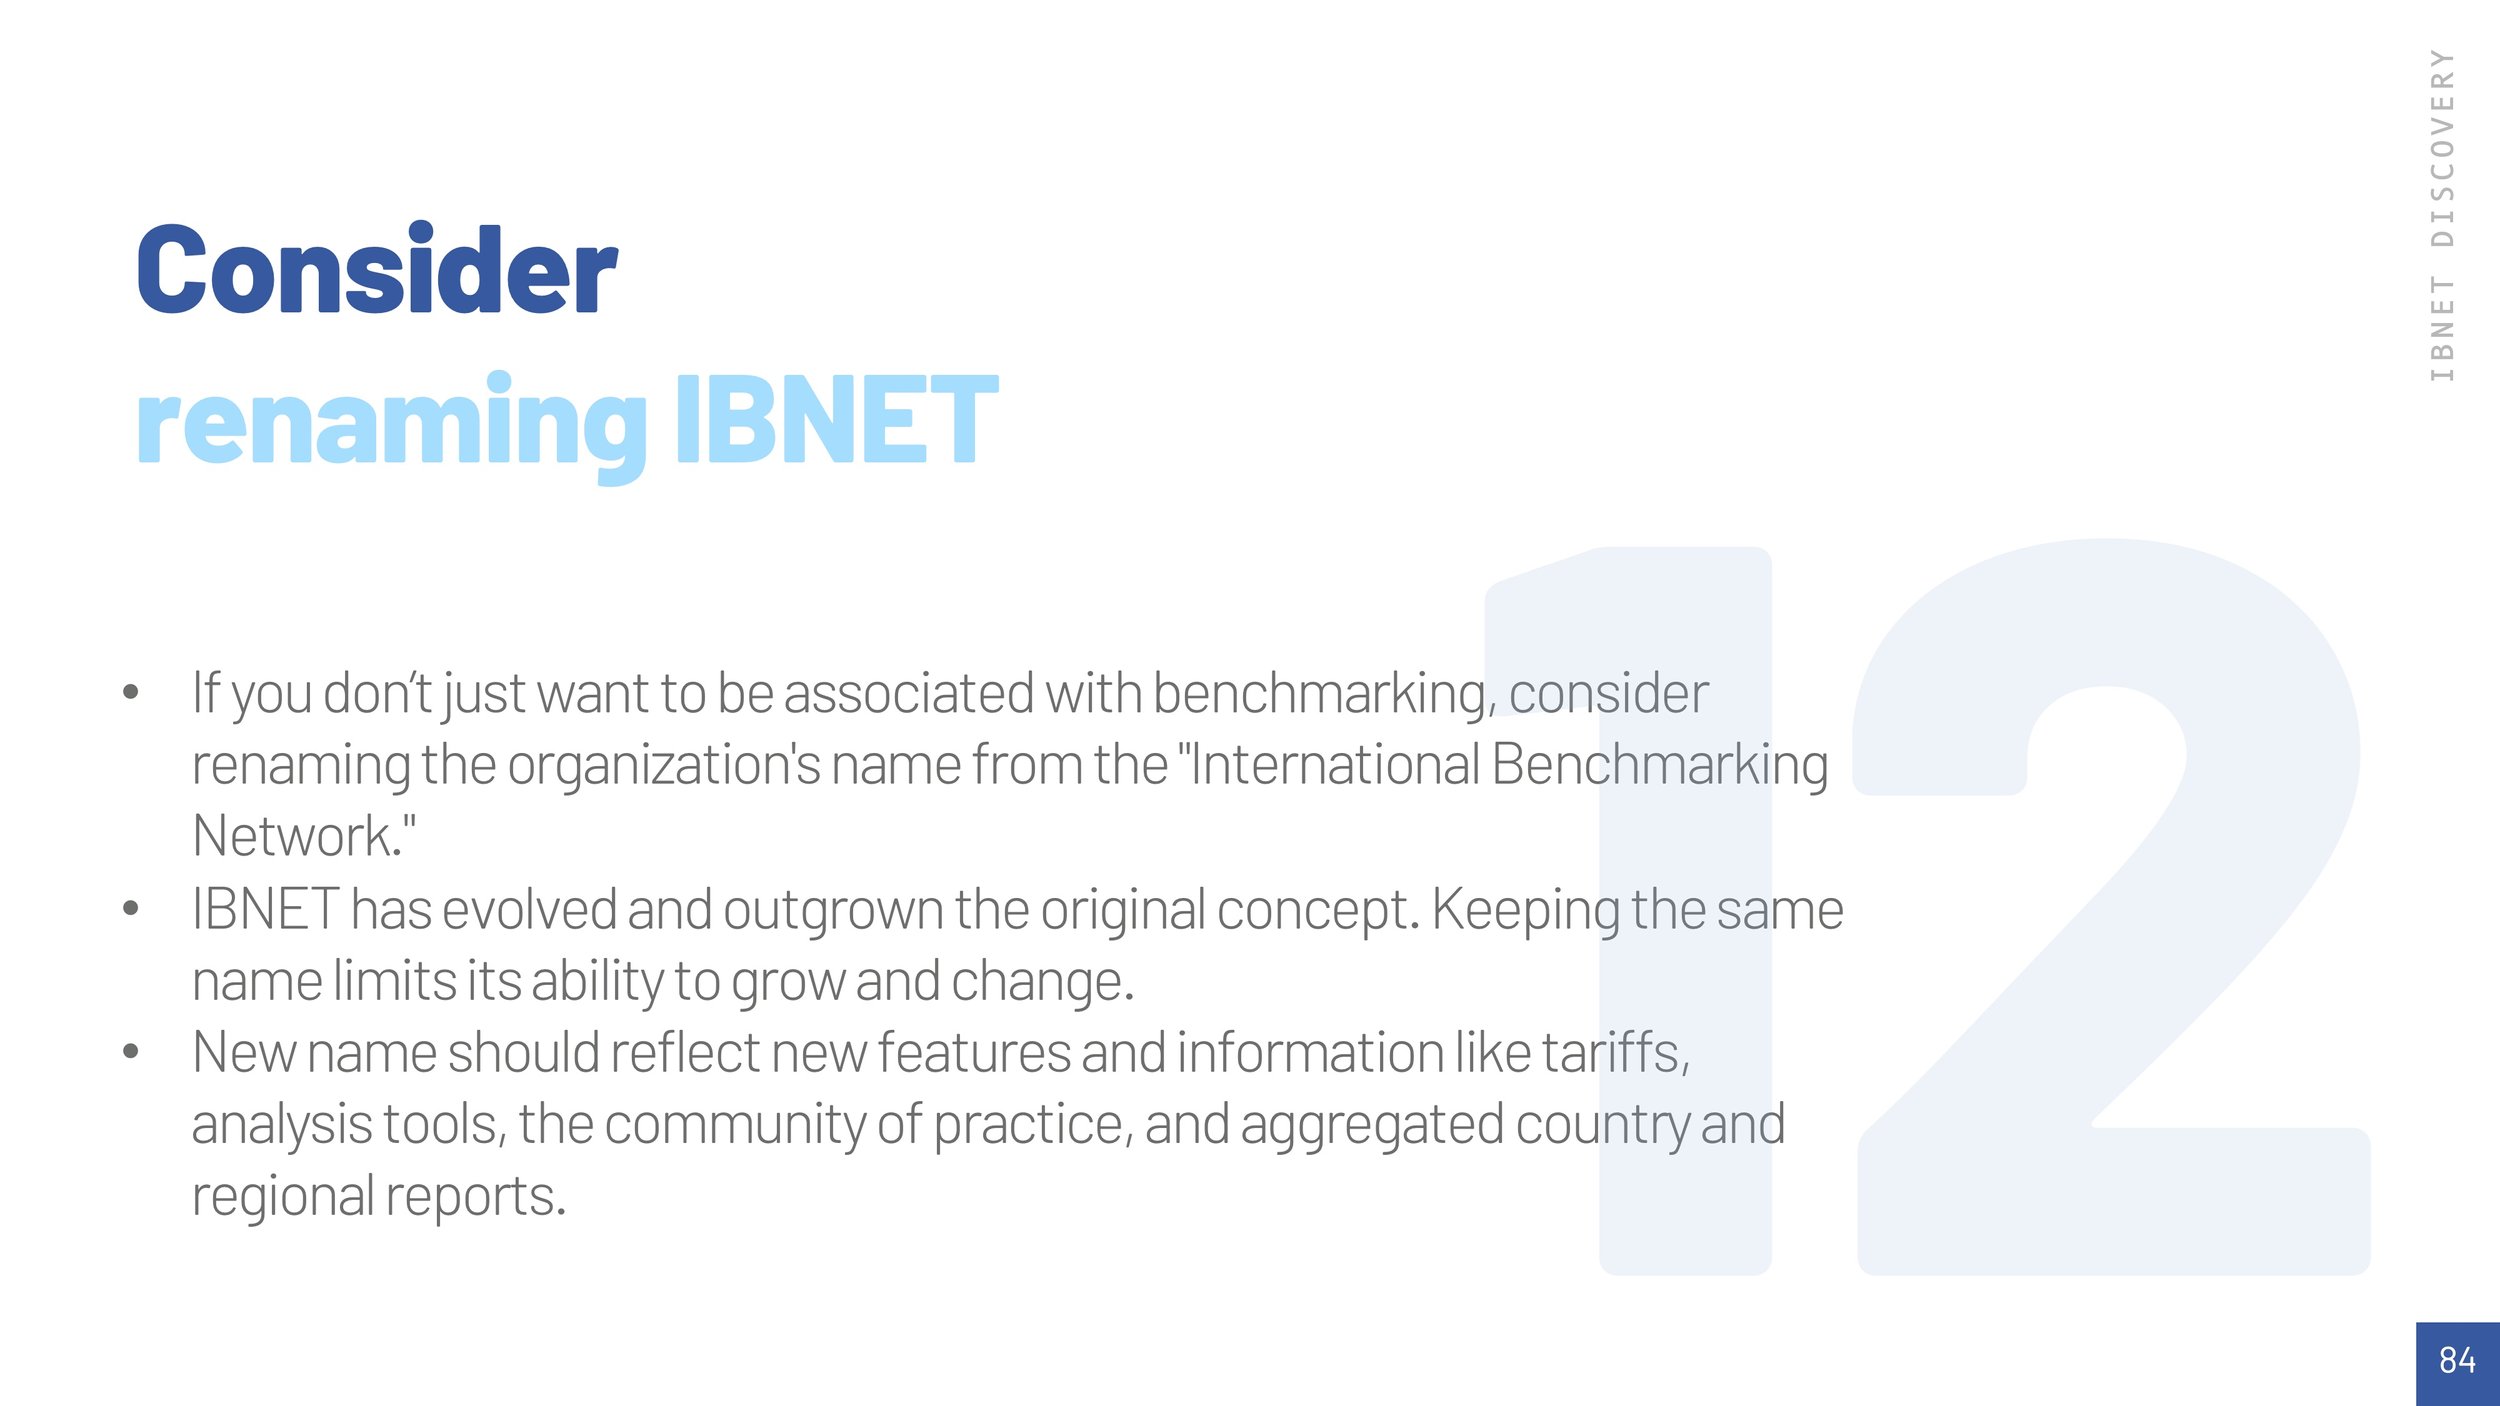
IBNET has outgrown its name.
IBNET has evolved and outgrown its original concept (It’s more than just benchmarking now!). Keeping the same name limits its ability to grow and change.
Defining User Personas
With the guidance of the IBNET team, I identified the four primary user groups as Water and Sanitation Utilities, Regulators, the WBG and IBNET team, and Development Planners.
I put together personas to better understand users' needs, experiences, behaviors and goals, so that we can designing without preconceived assumptions.
Discovery Recommendations
After reviewing all discovery findings and defining IBNET’s key audience groups, I created a detailed list of 14 recommendations that directly map back to the project goals, creating a strategy to get user engagement back up and expand IBNET into new areas. These recommendations were presented during the two hour discovery findings presentation meeting.
They can be summarized as:
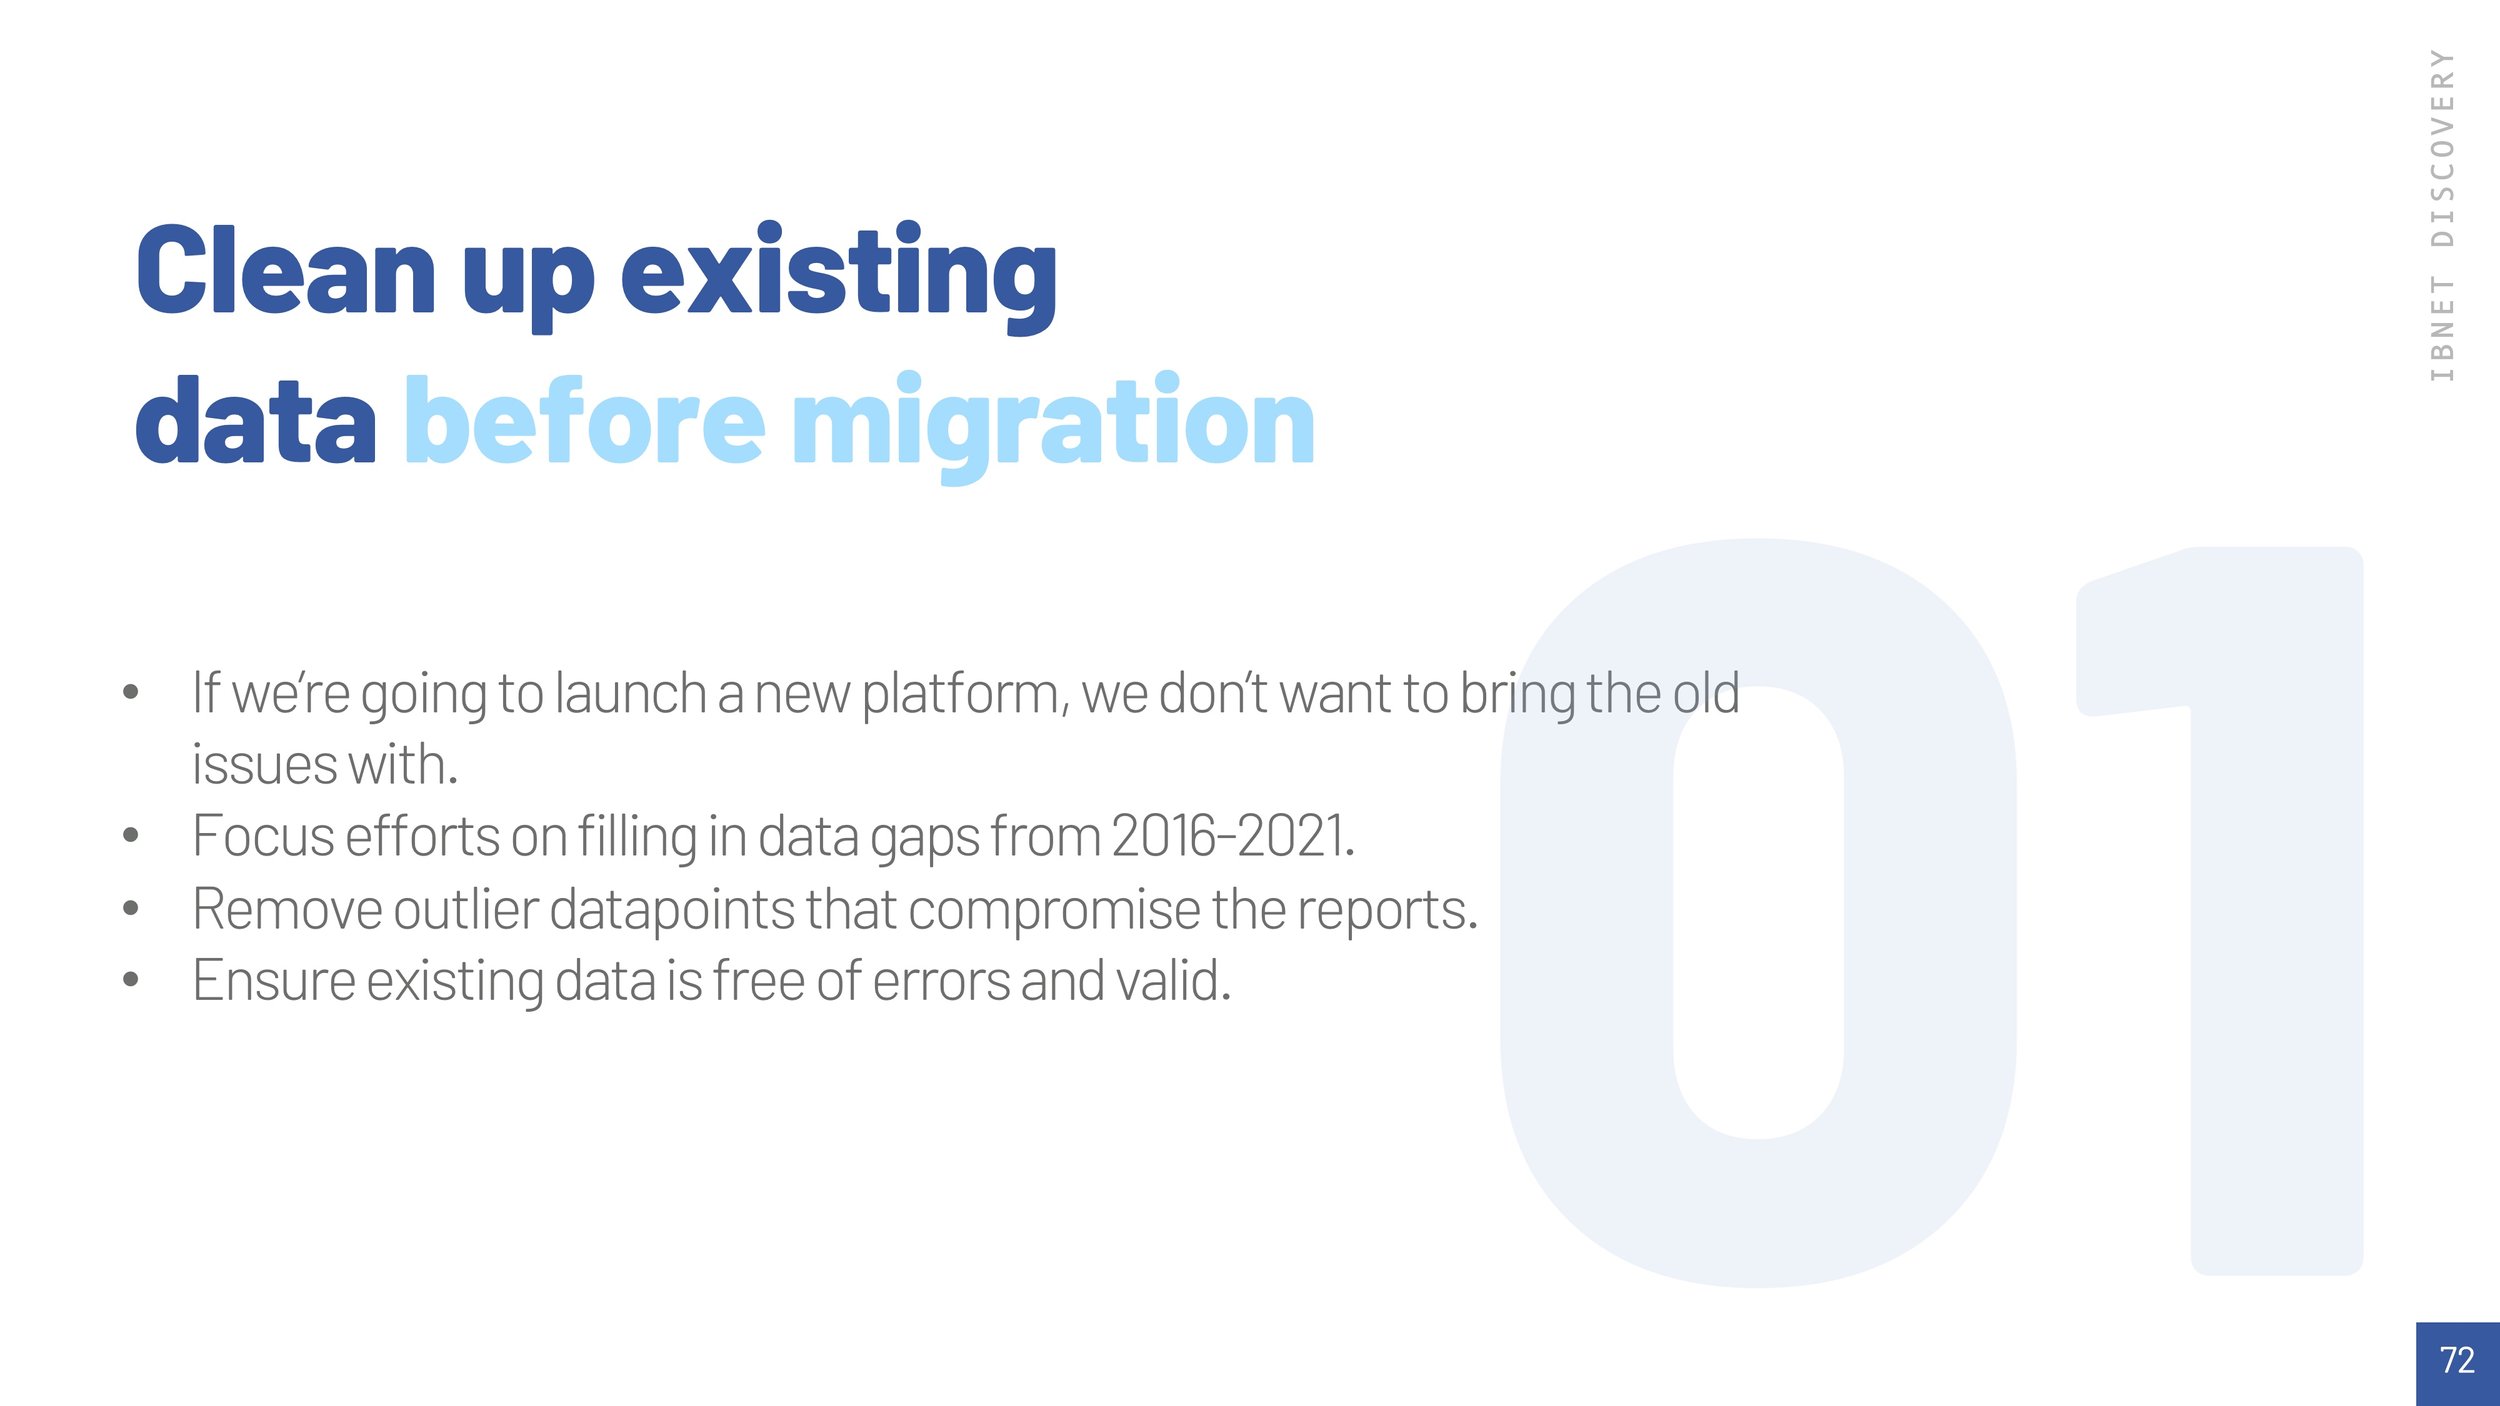
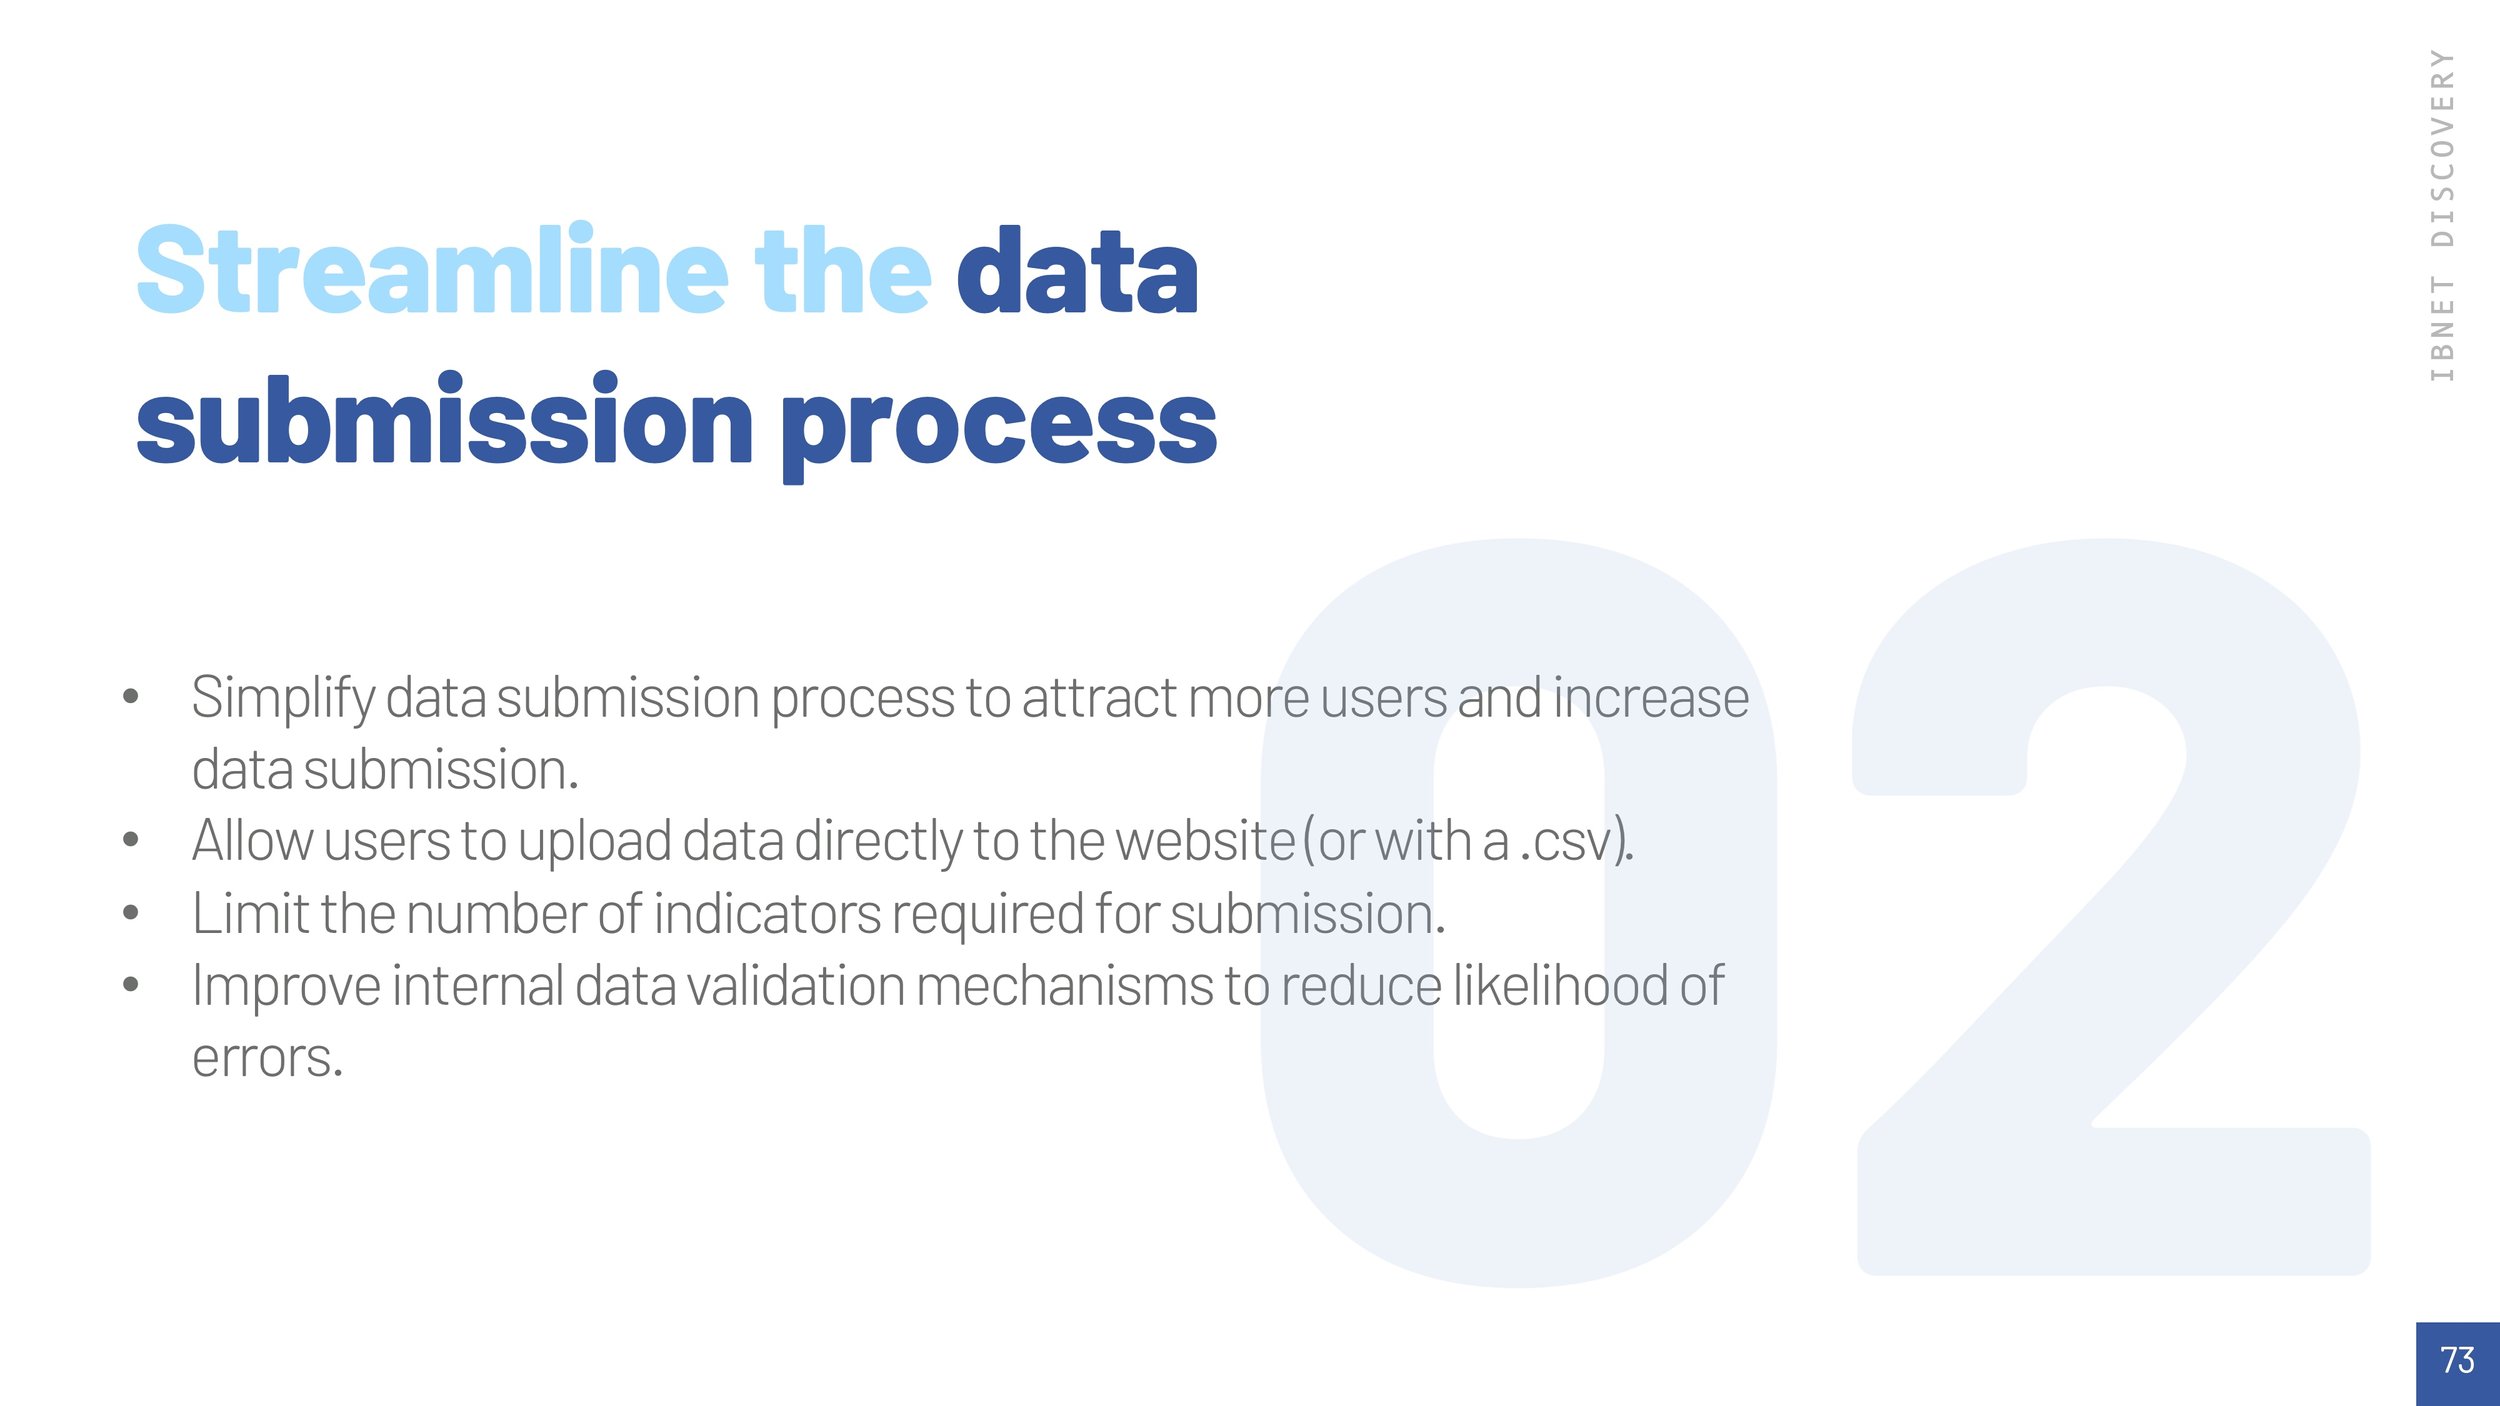
Streamline IBNET’s data submission process.
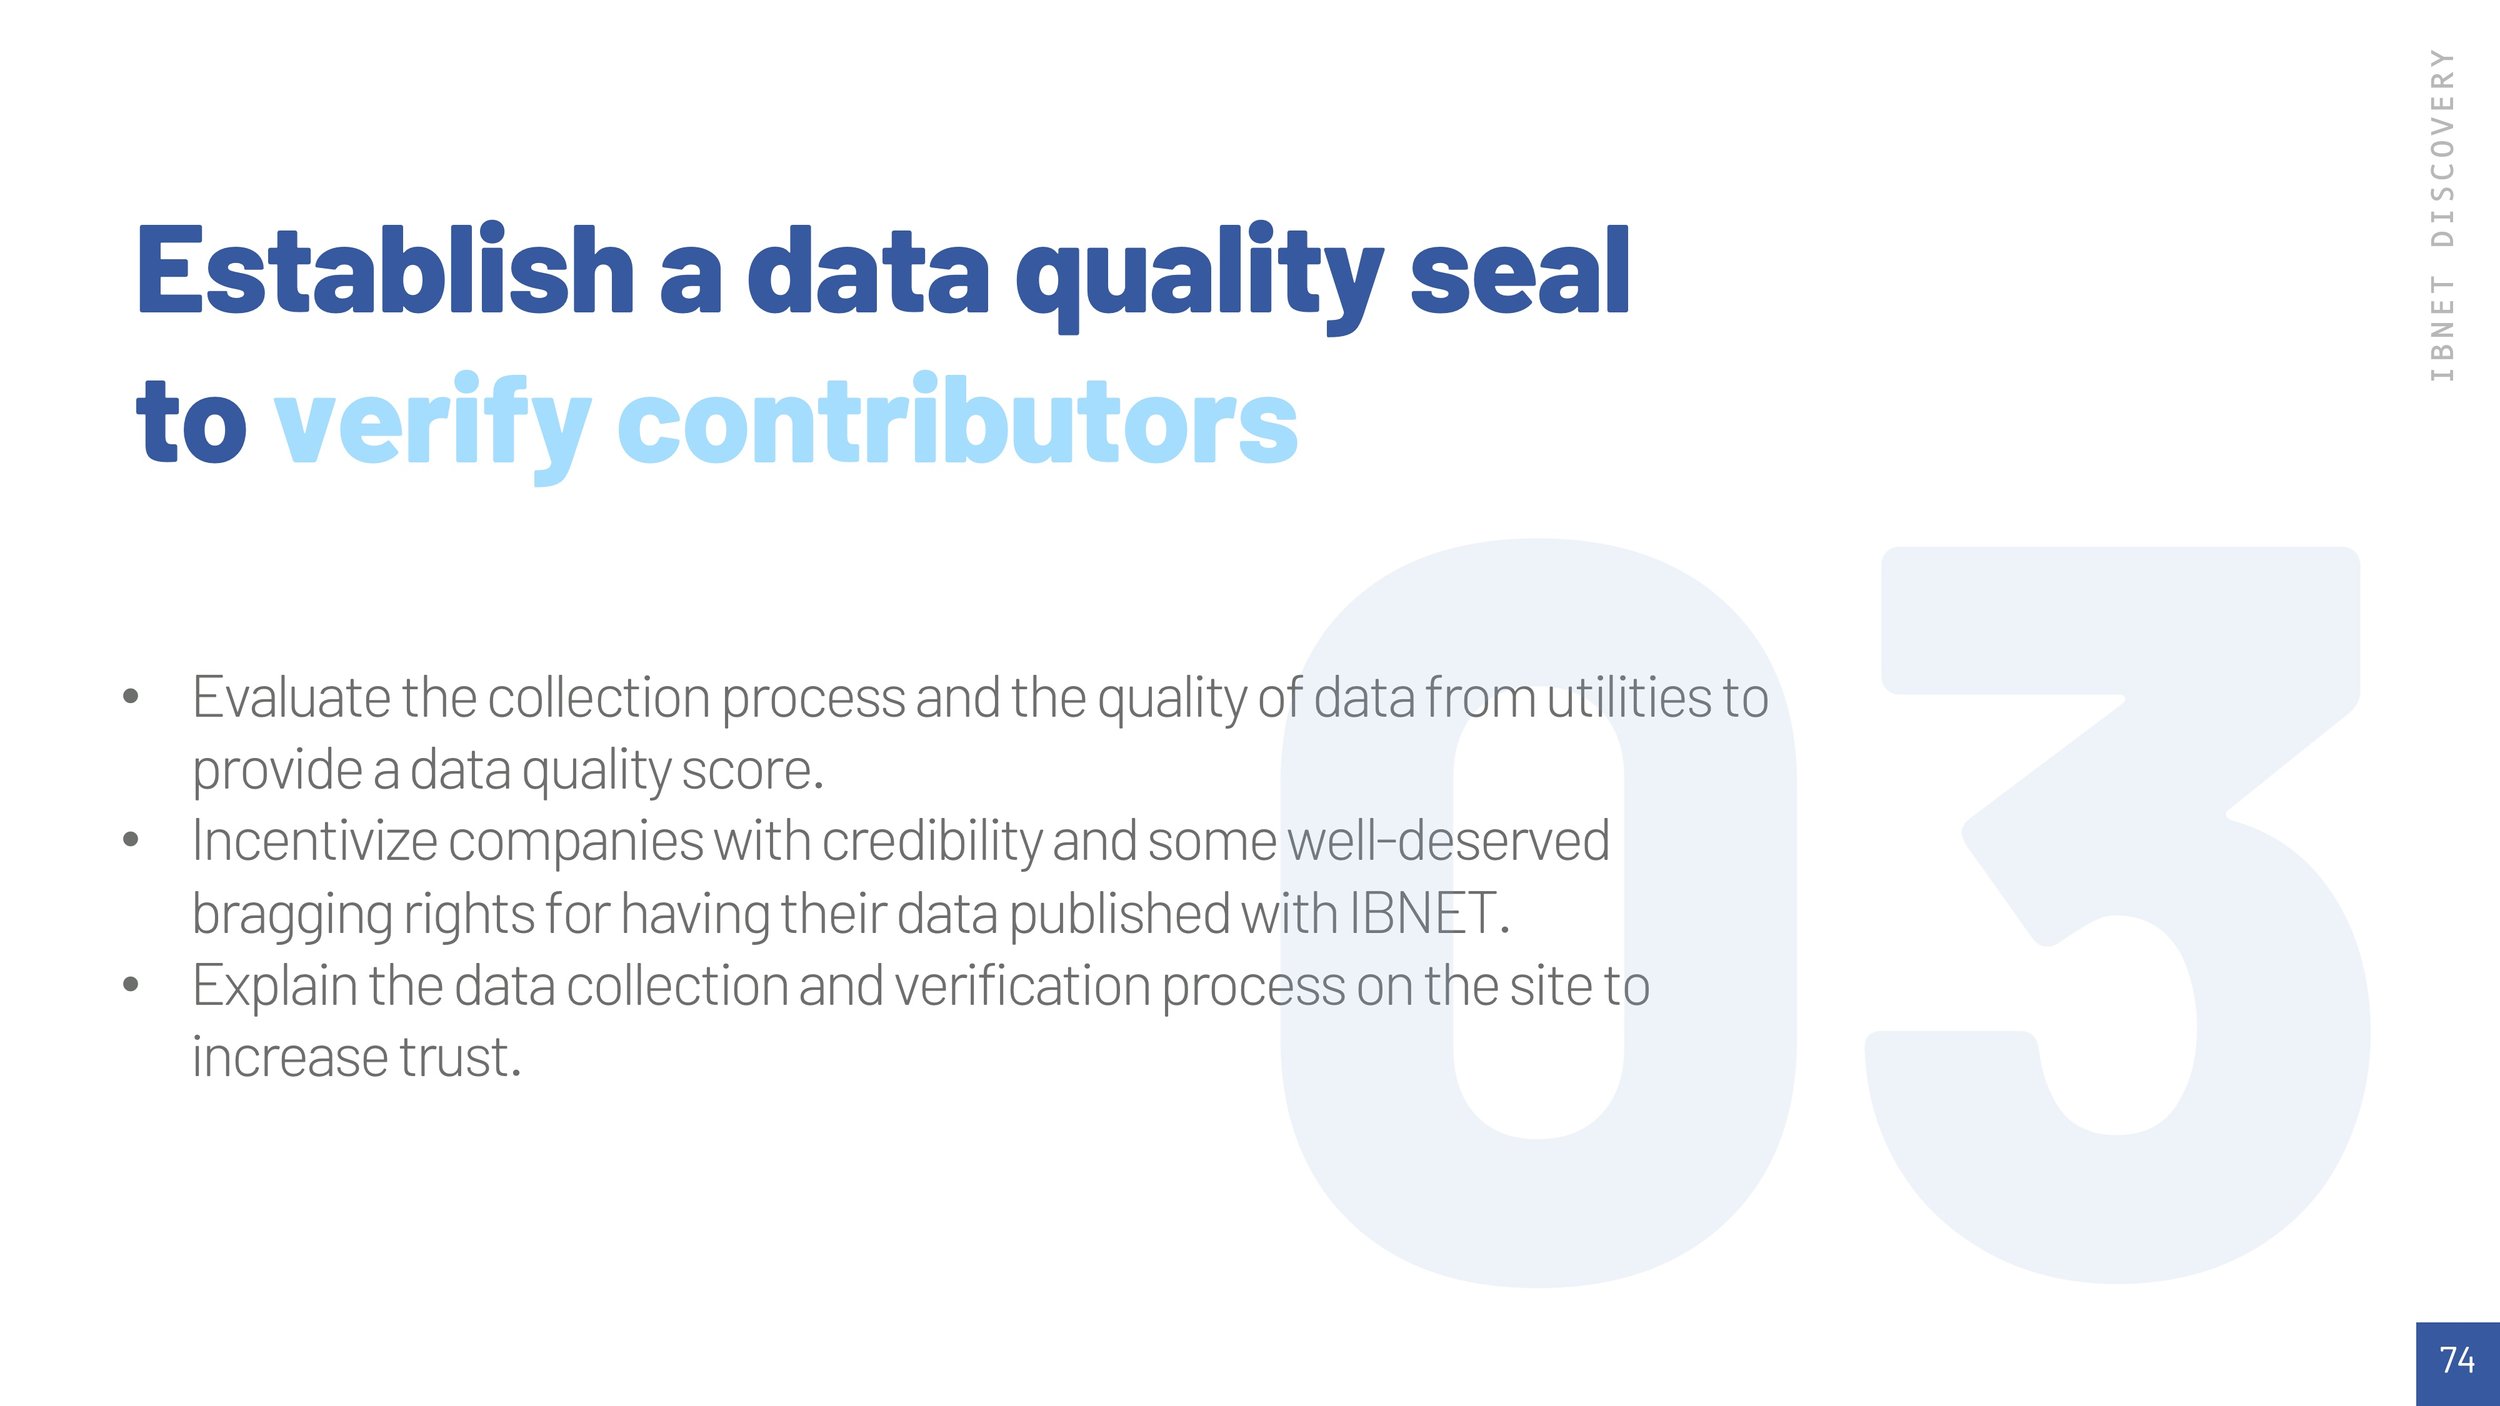
Create and highlight value for users who hold the data to incentivize data upload.
Integrate Tableau for visually immersive and interactive data visualizations.
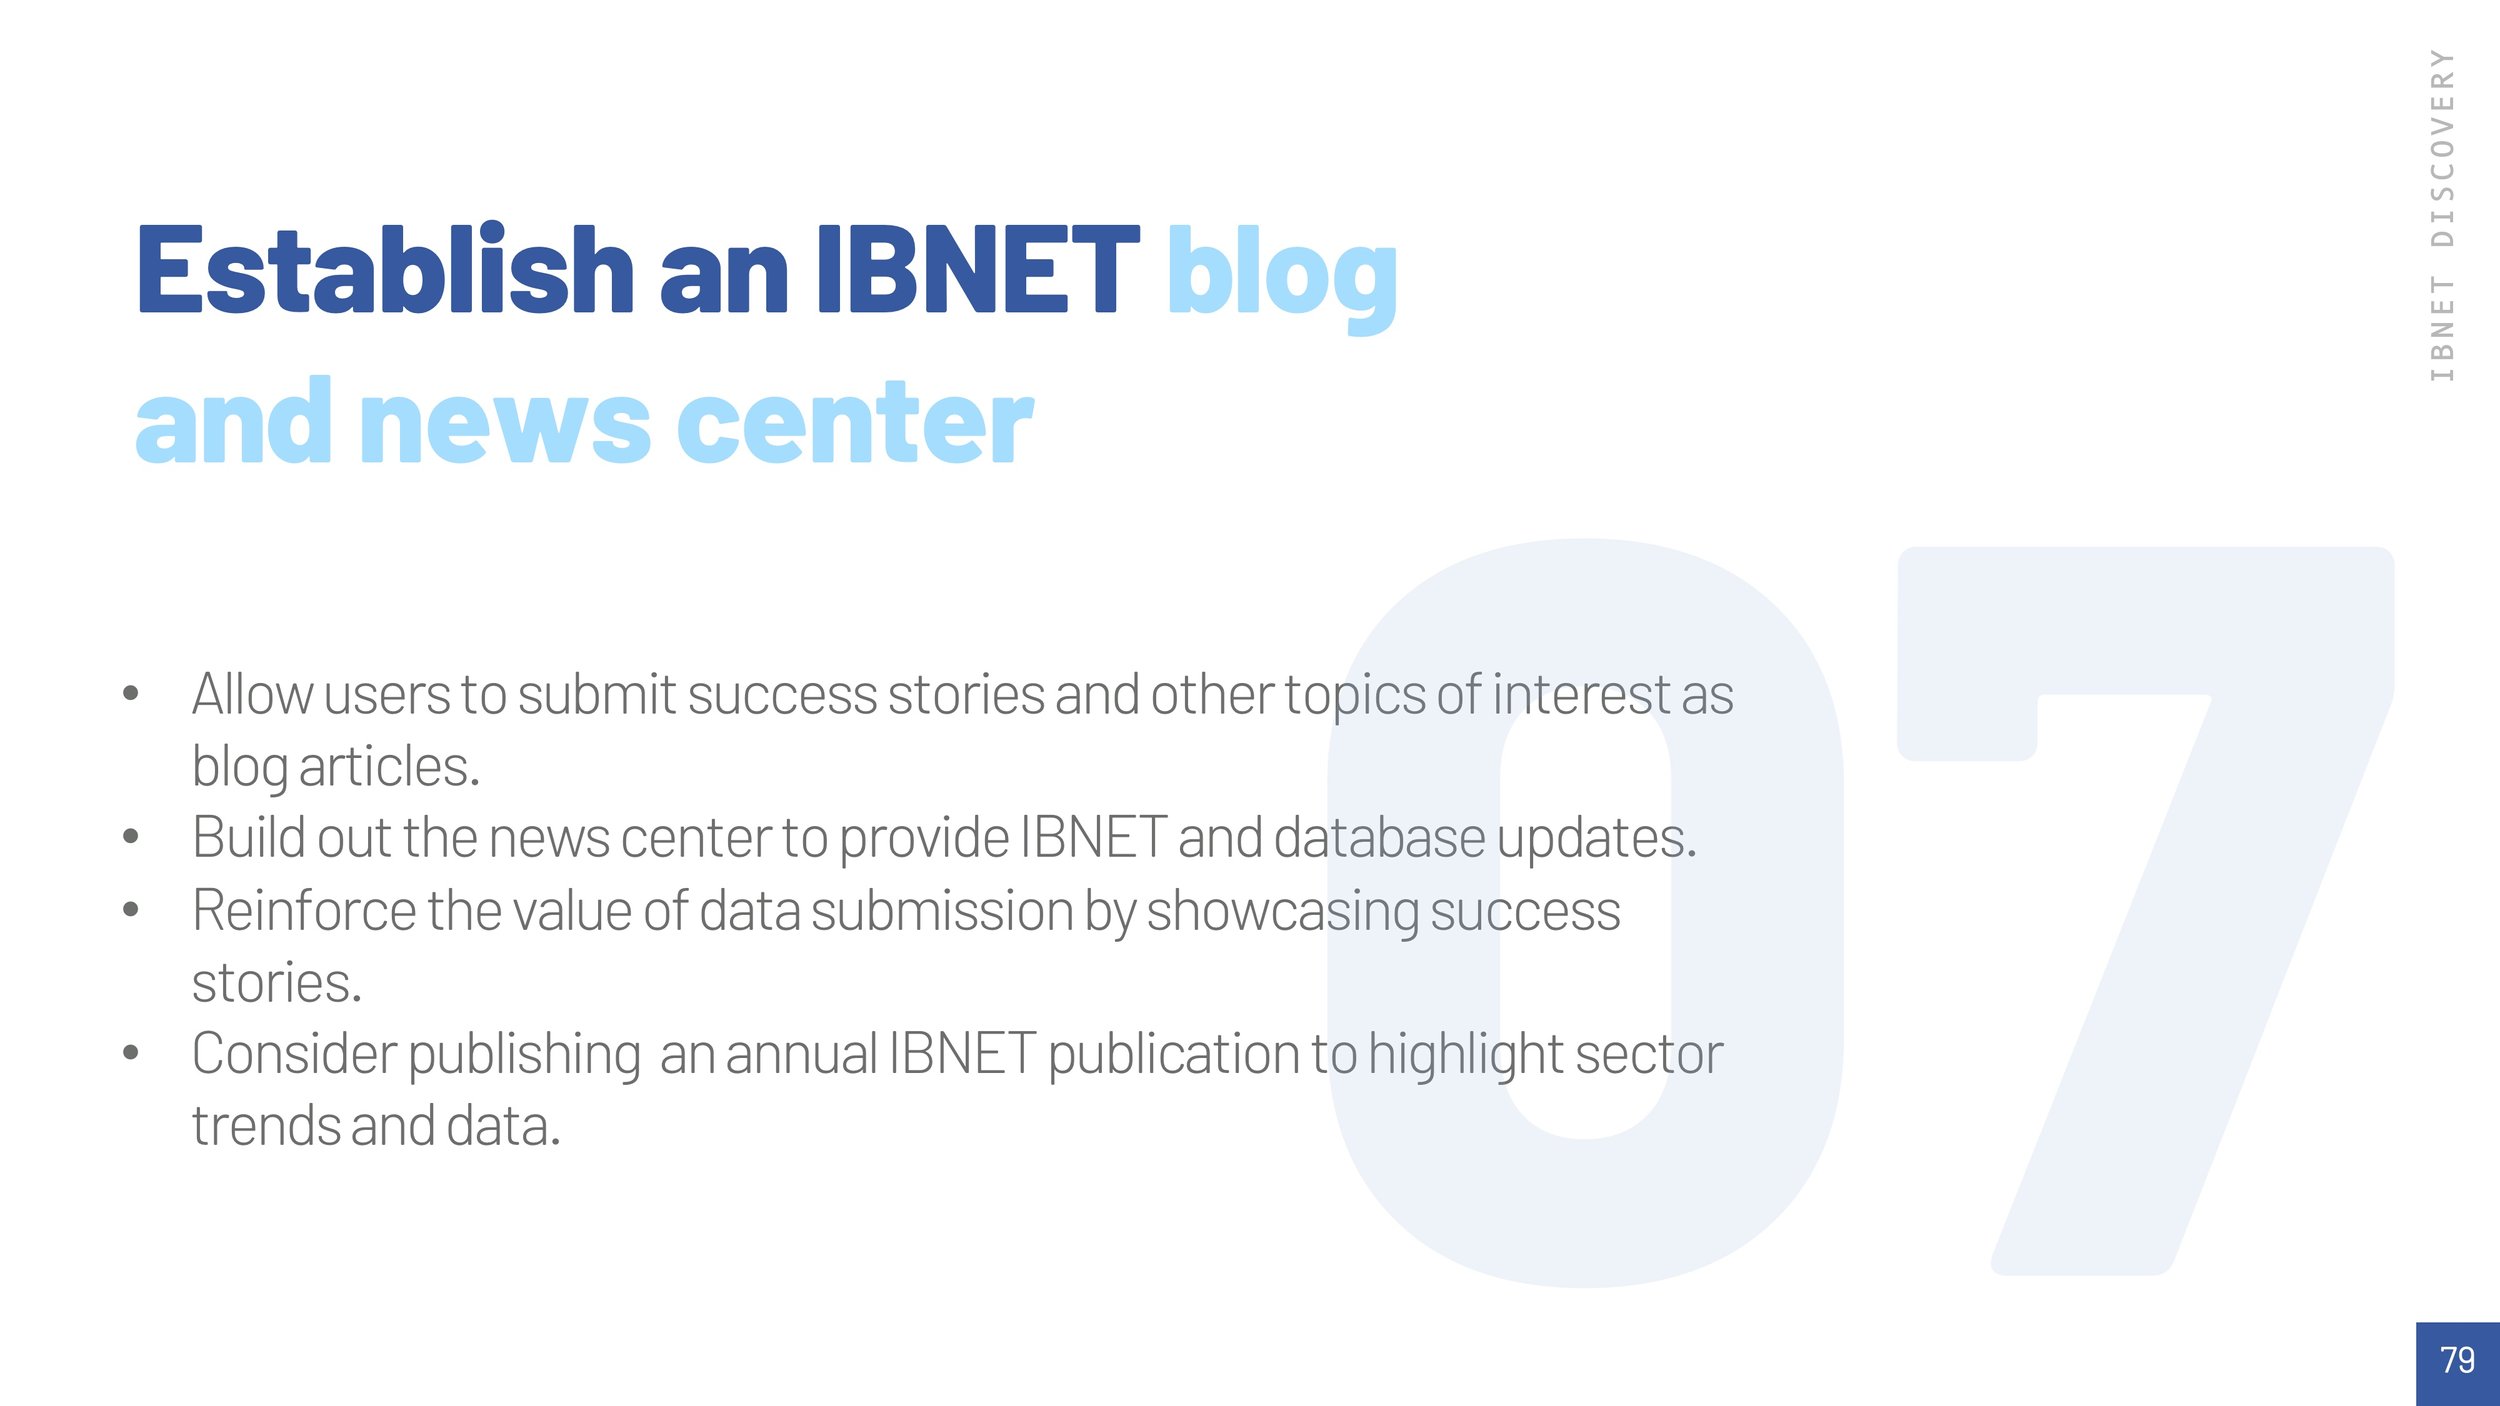
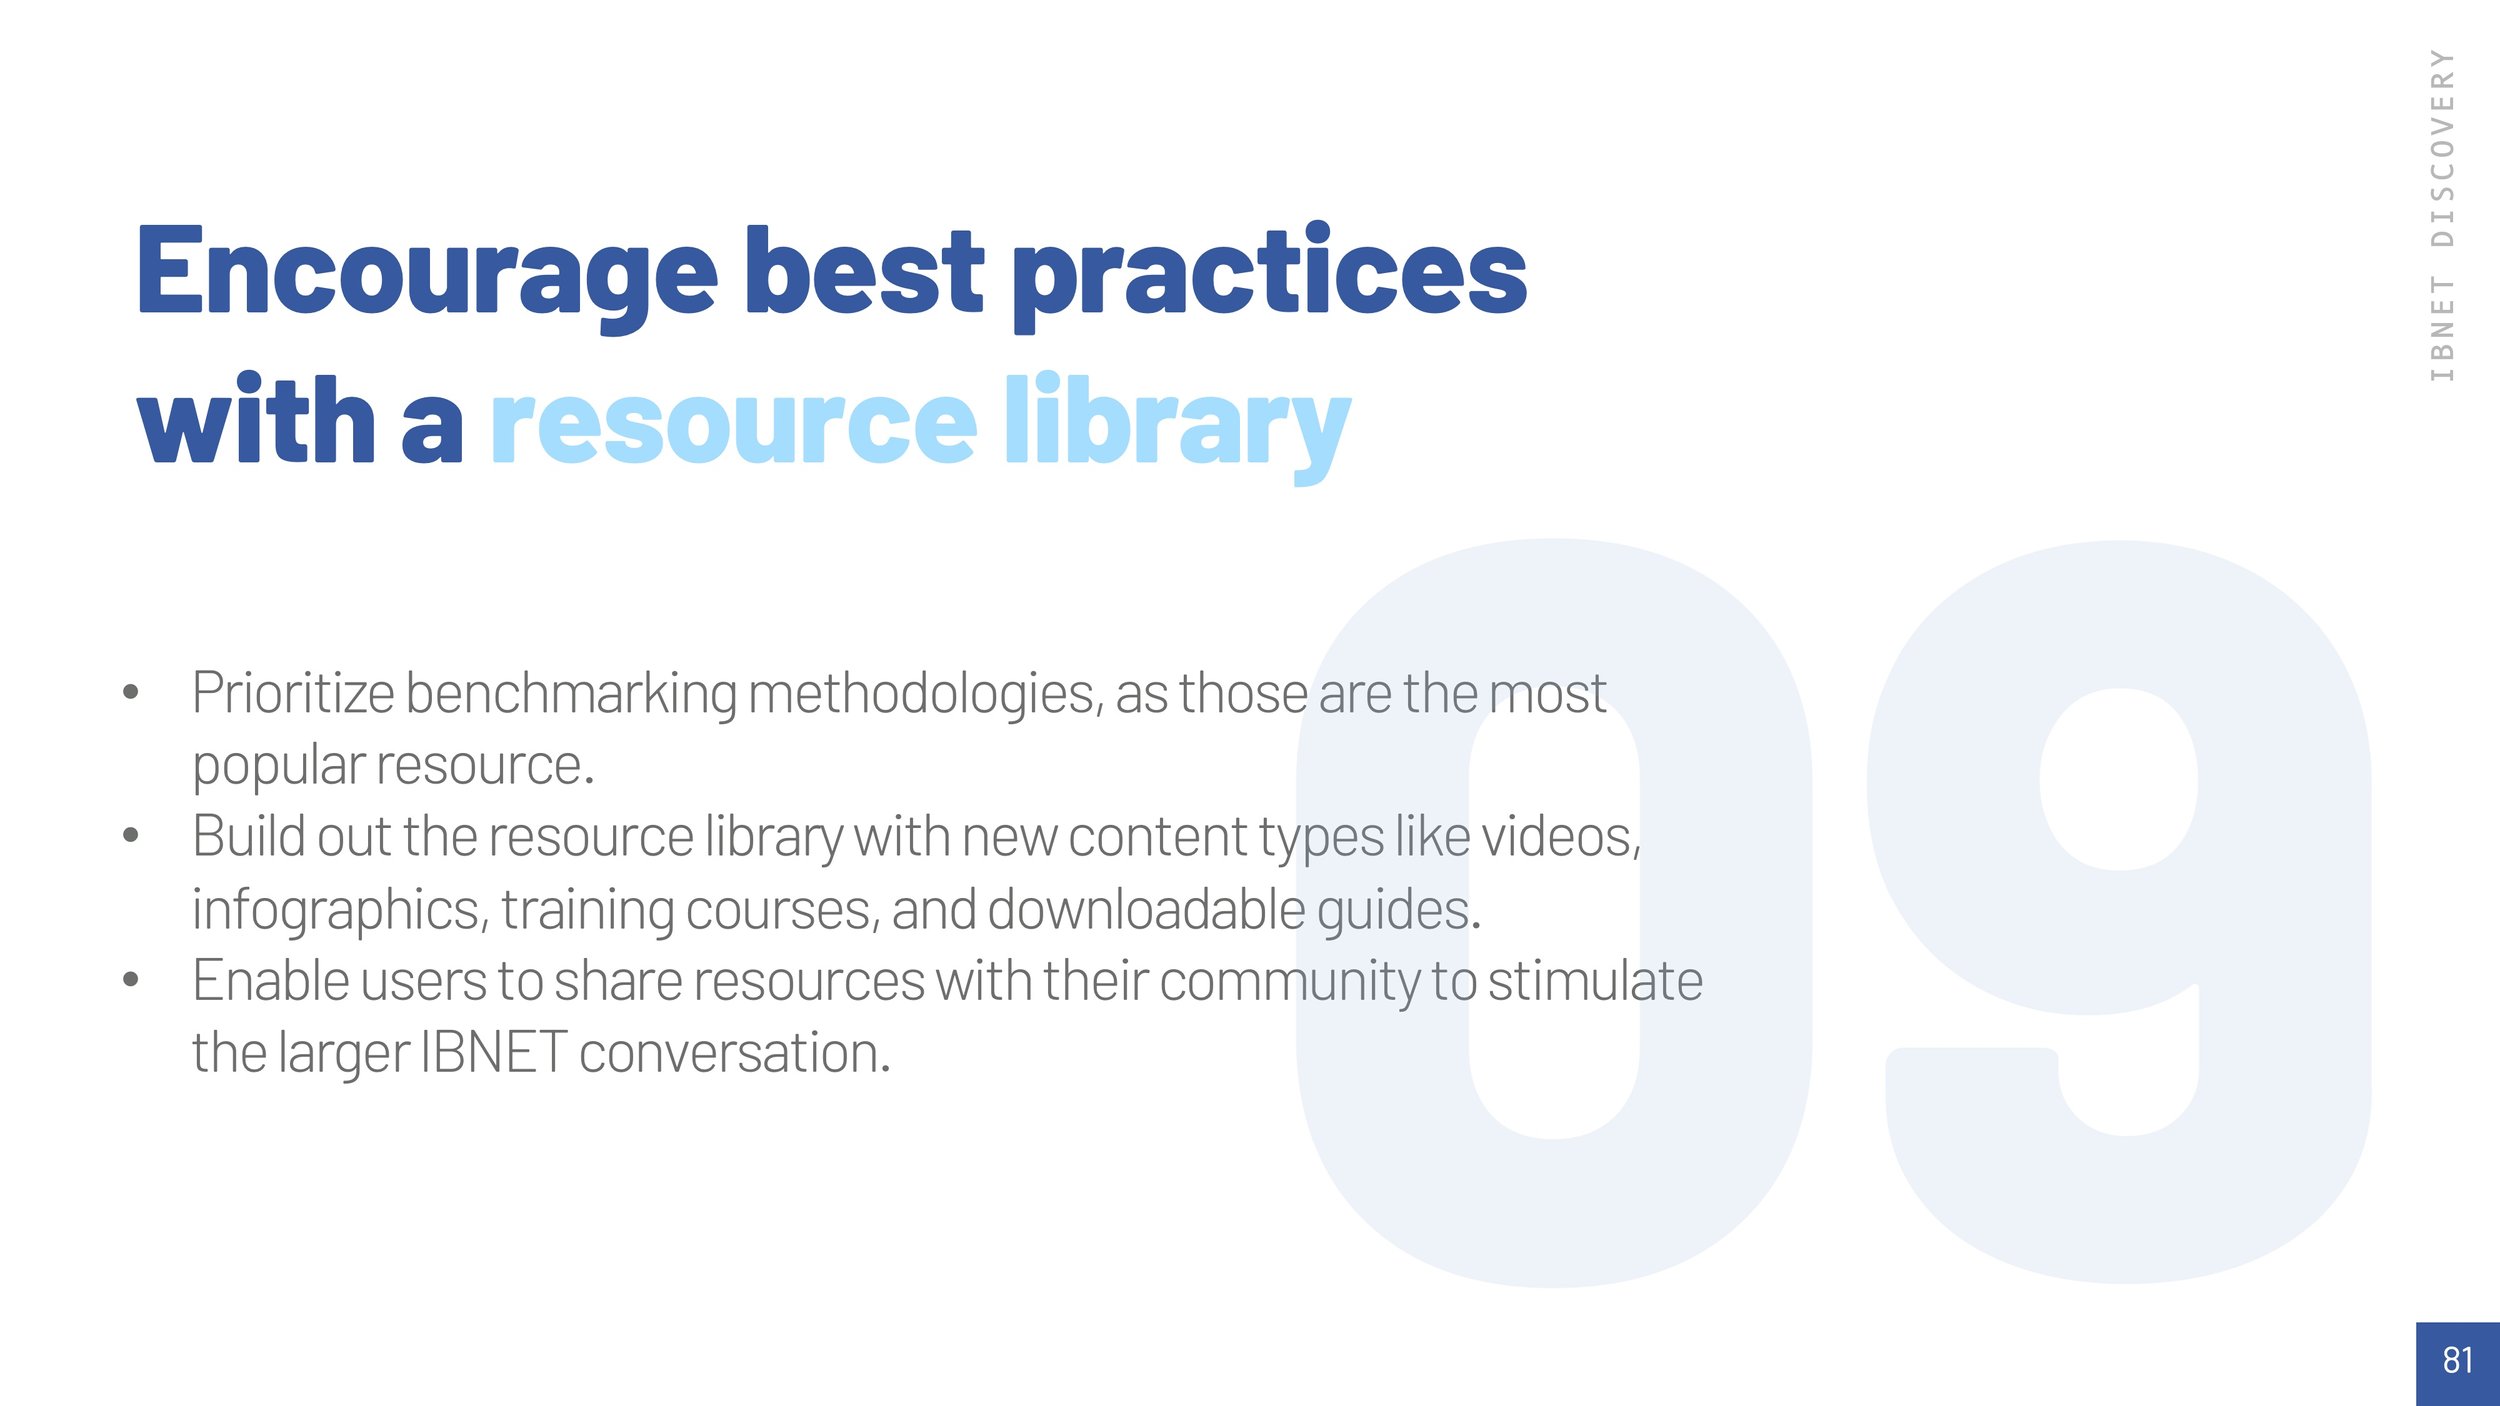
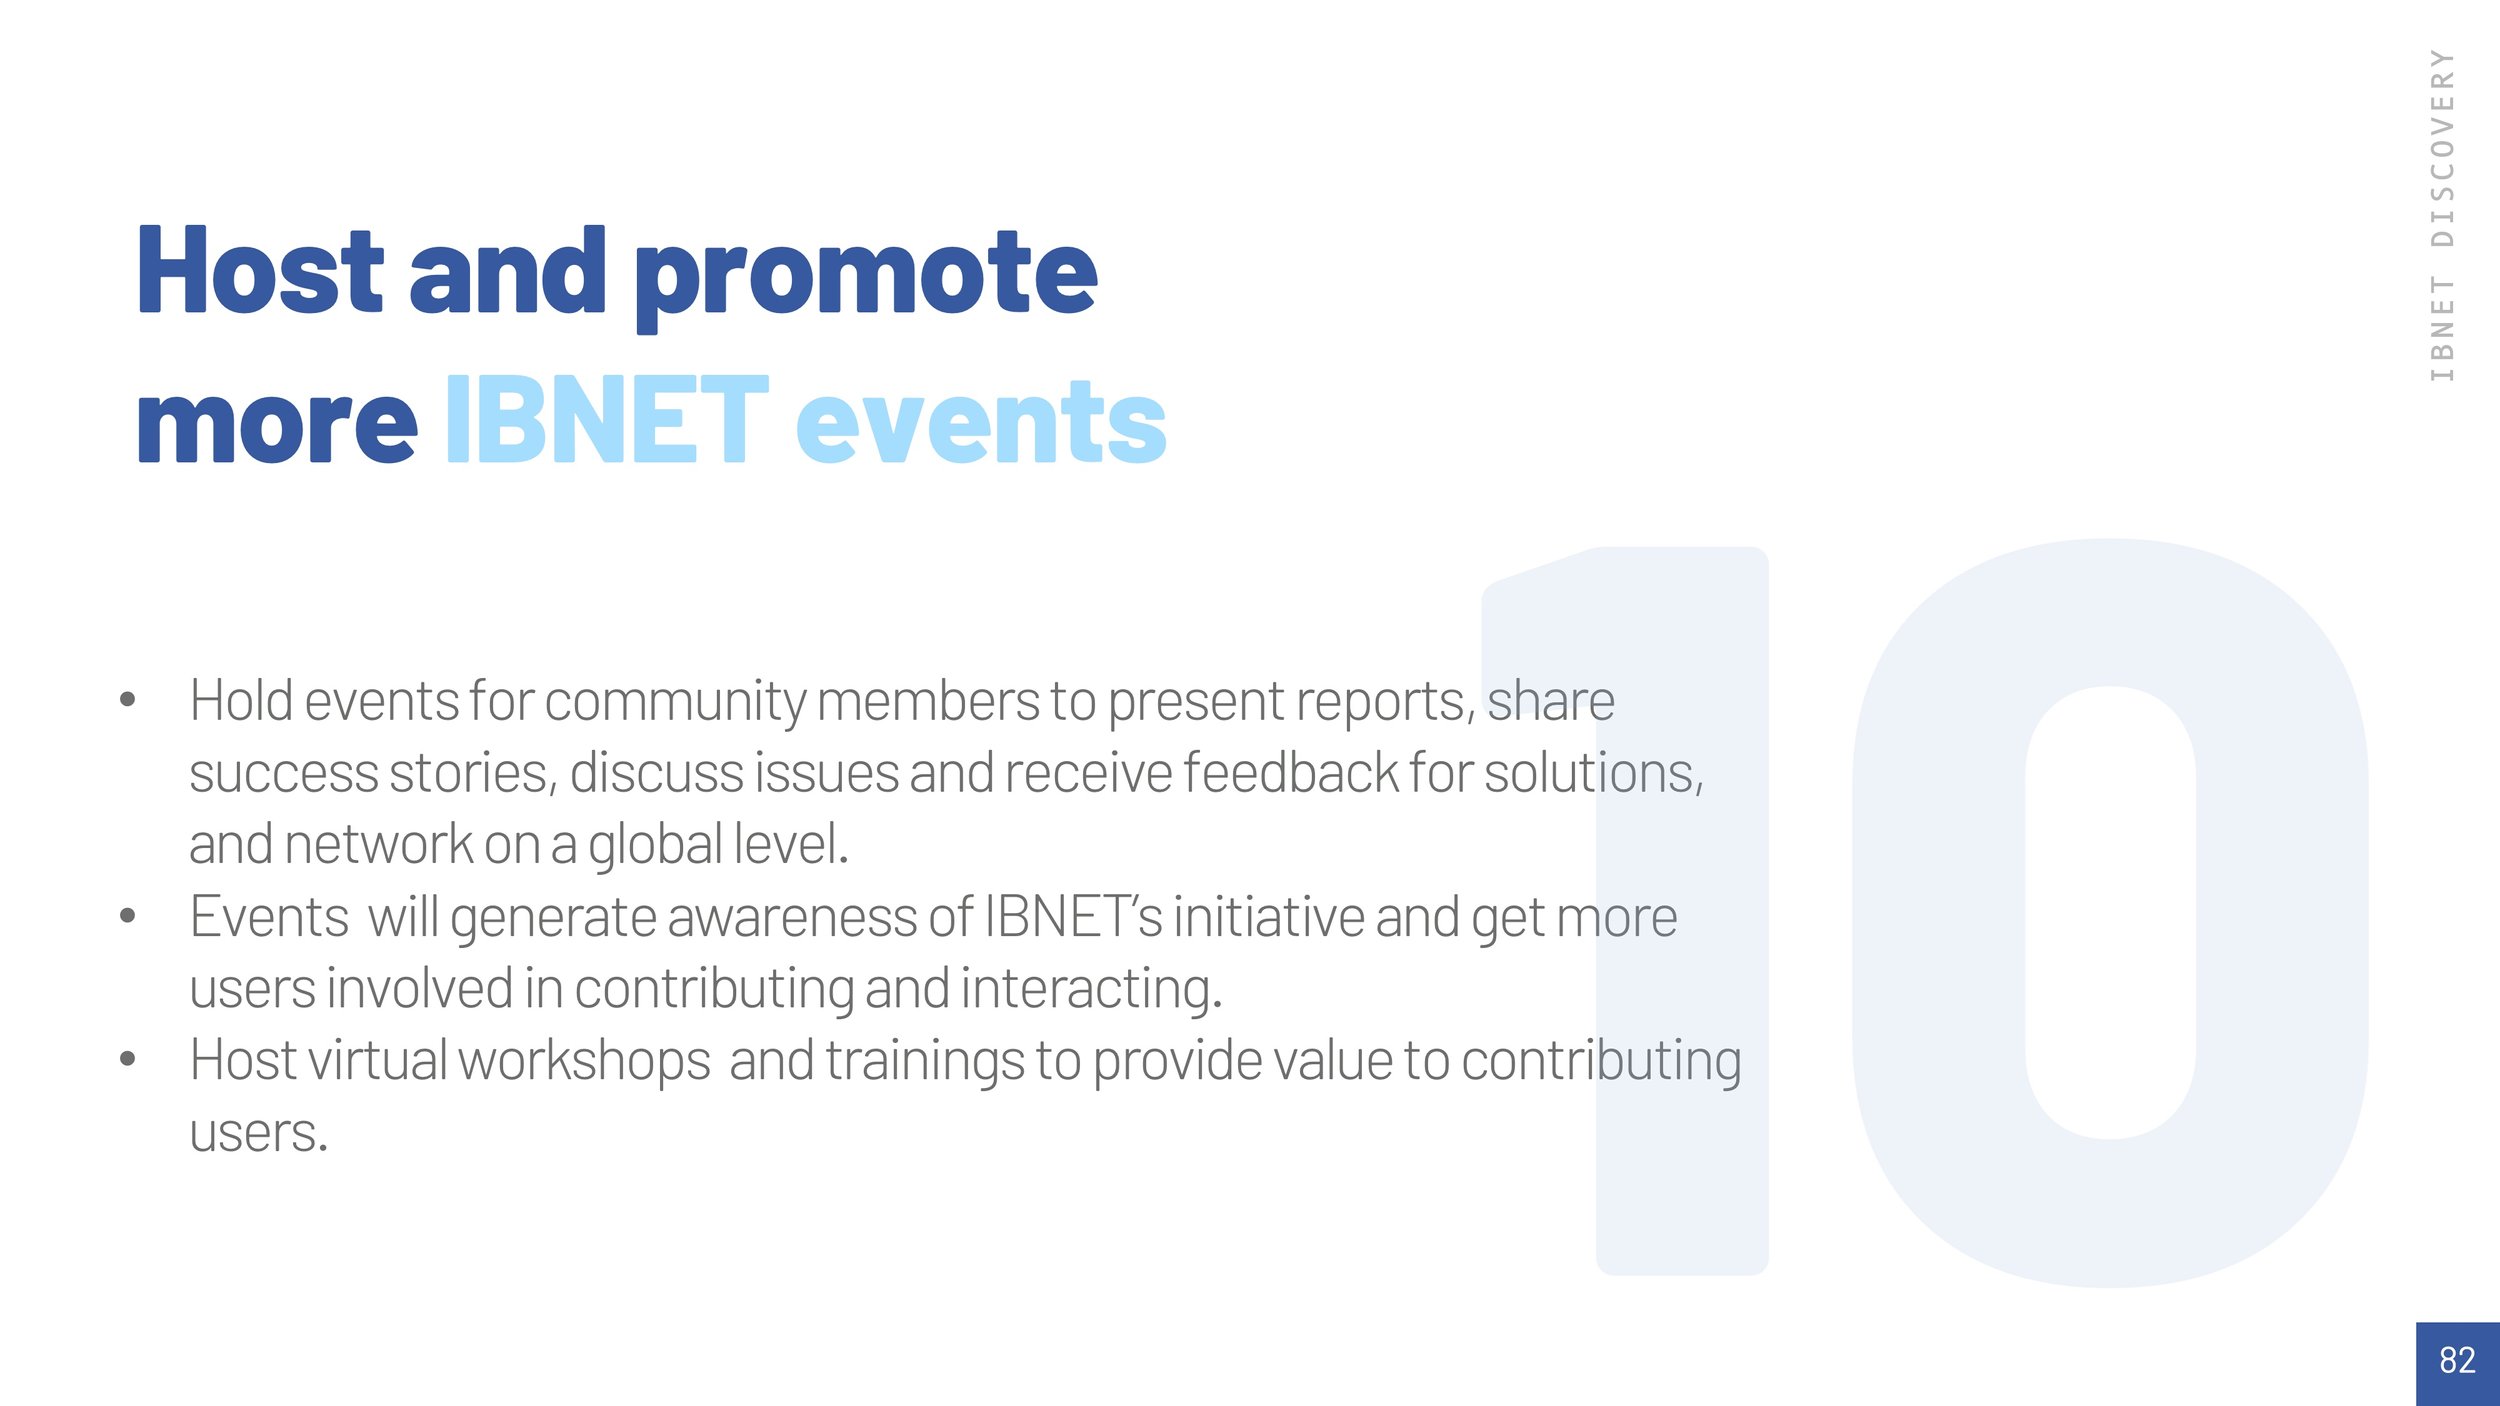
Establish IBNET as a community of practice with resources, blogs, trainings, events, forums, and a member directory service.
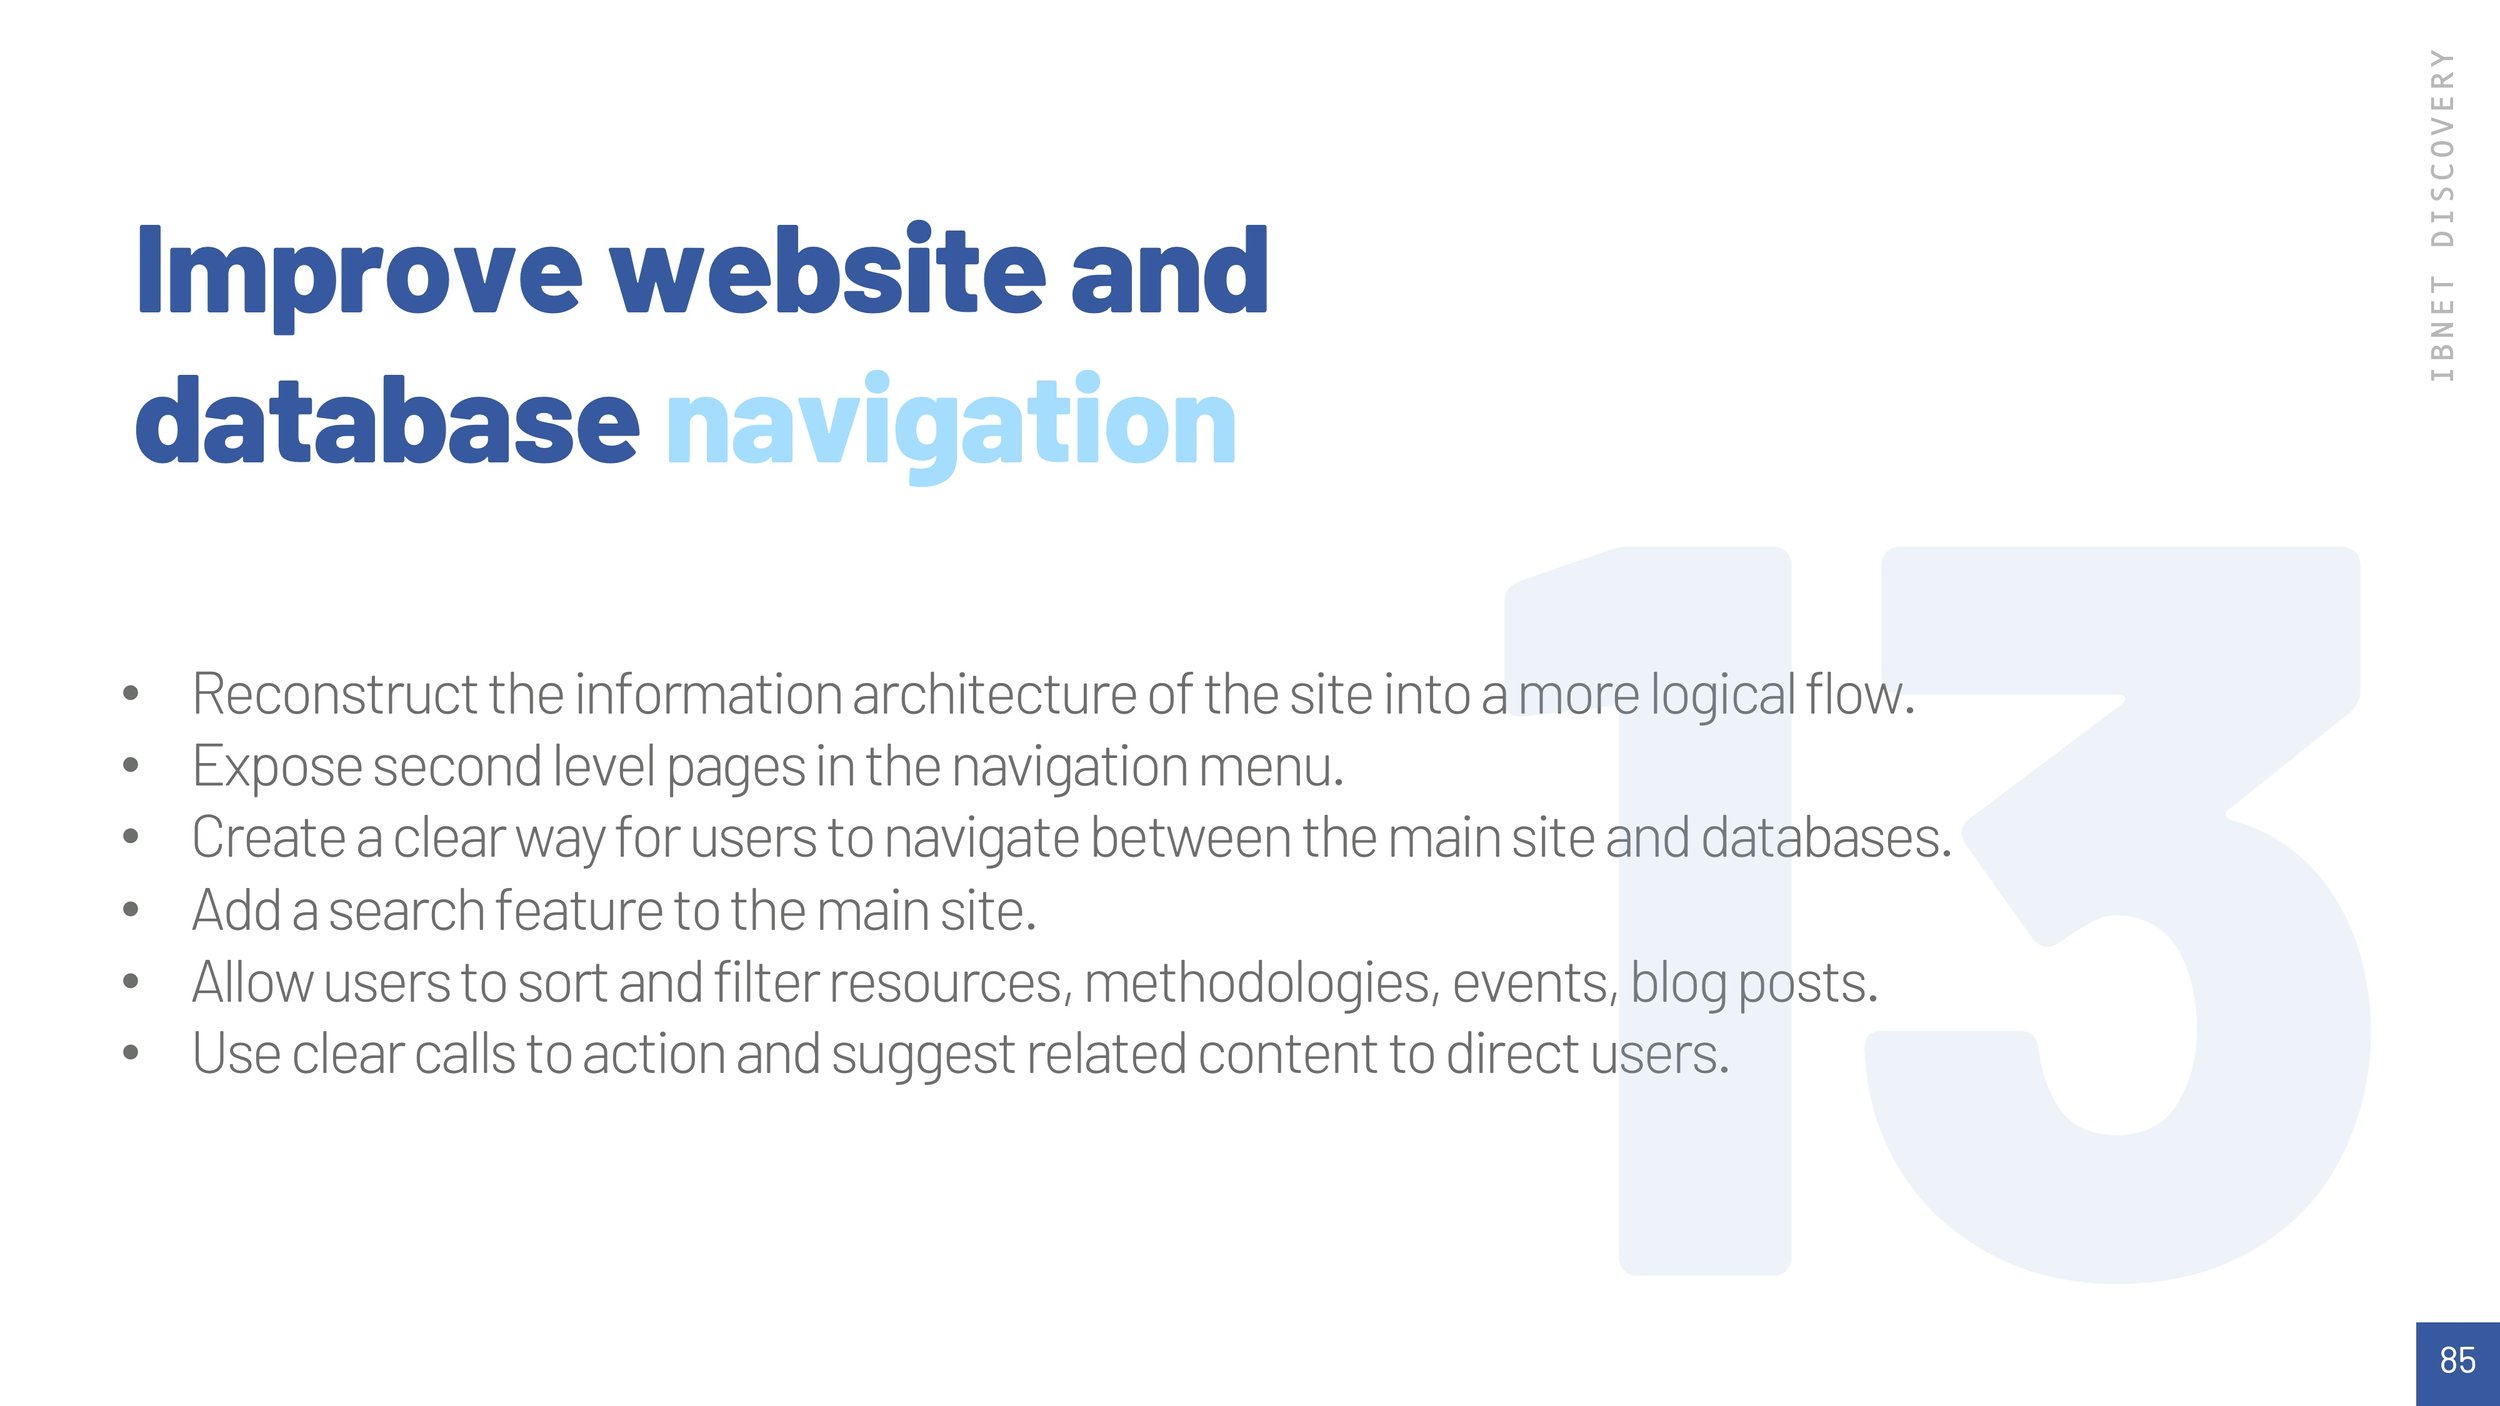
Improve the website and database navigation and design.


Information Architecture
Content Audit:
Before drafting a new site map, it’s important to do a site crawl and evaluate the structure of all the site’s URLs.
After crawling the site with ScreamingFrog, I put together a content audit spreadsheet to compile all the site URLs, organized by site section and worked with the client to mark pages as Keep, Delete, or Merge.
Card Sort:
I held a two hour, in person card sorting meeting with IBNET’s team, facilitating the restructuring of the I.A.
Through the new site map, I prioritized data upload and a new section for community.
Taxonomy:
With the introduction of so much new content, it was important to restructure and expand the site’s taxonomy.
I created a taxonomy spreadsheet with a proposed list of categories and tags for all the content types, then held an hour long meeting with IBNET’s team to review it.
After a few modifications, the taxonomy list was finalized and I proceeded to wireframing.
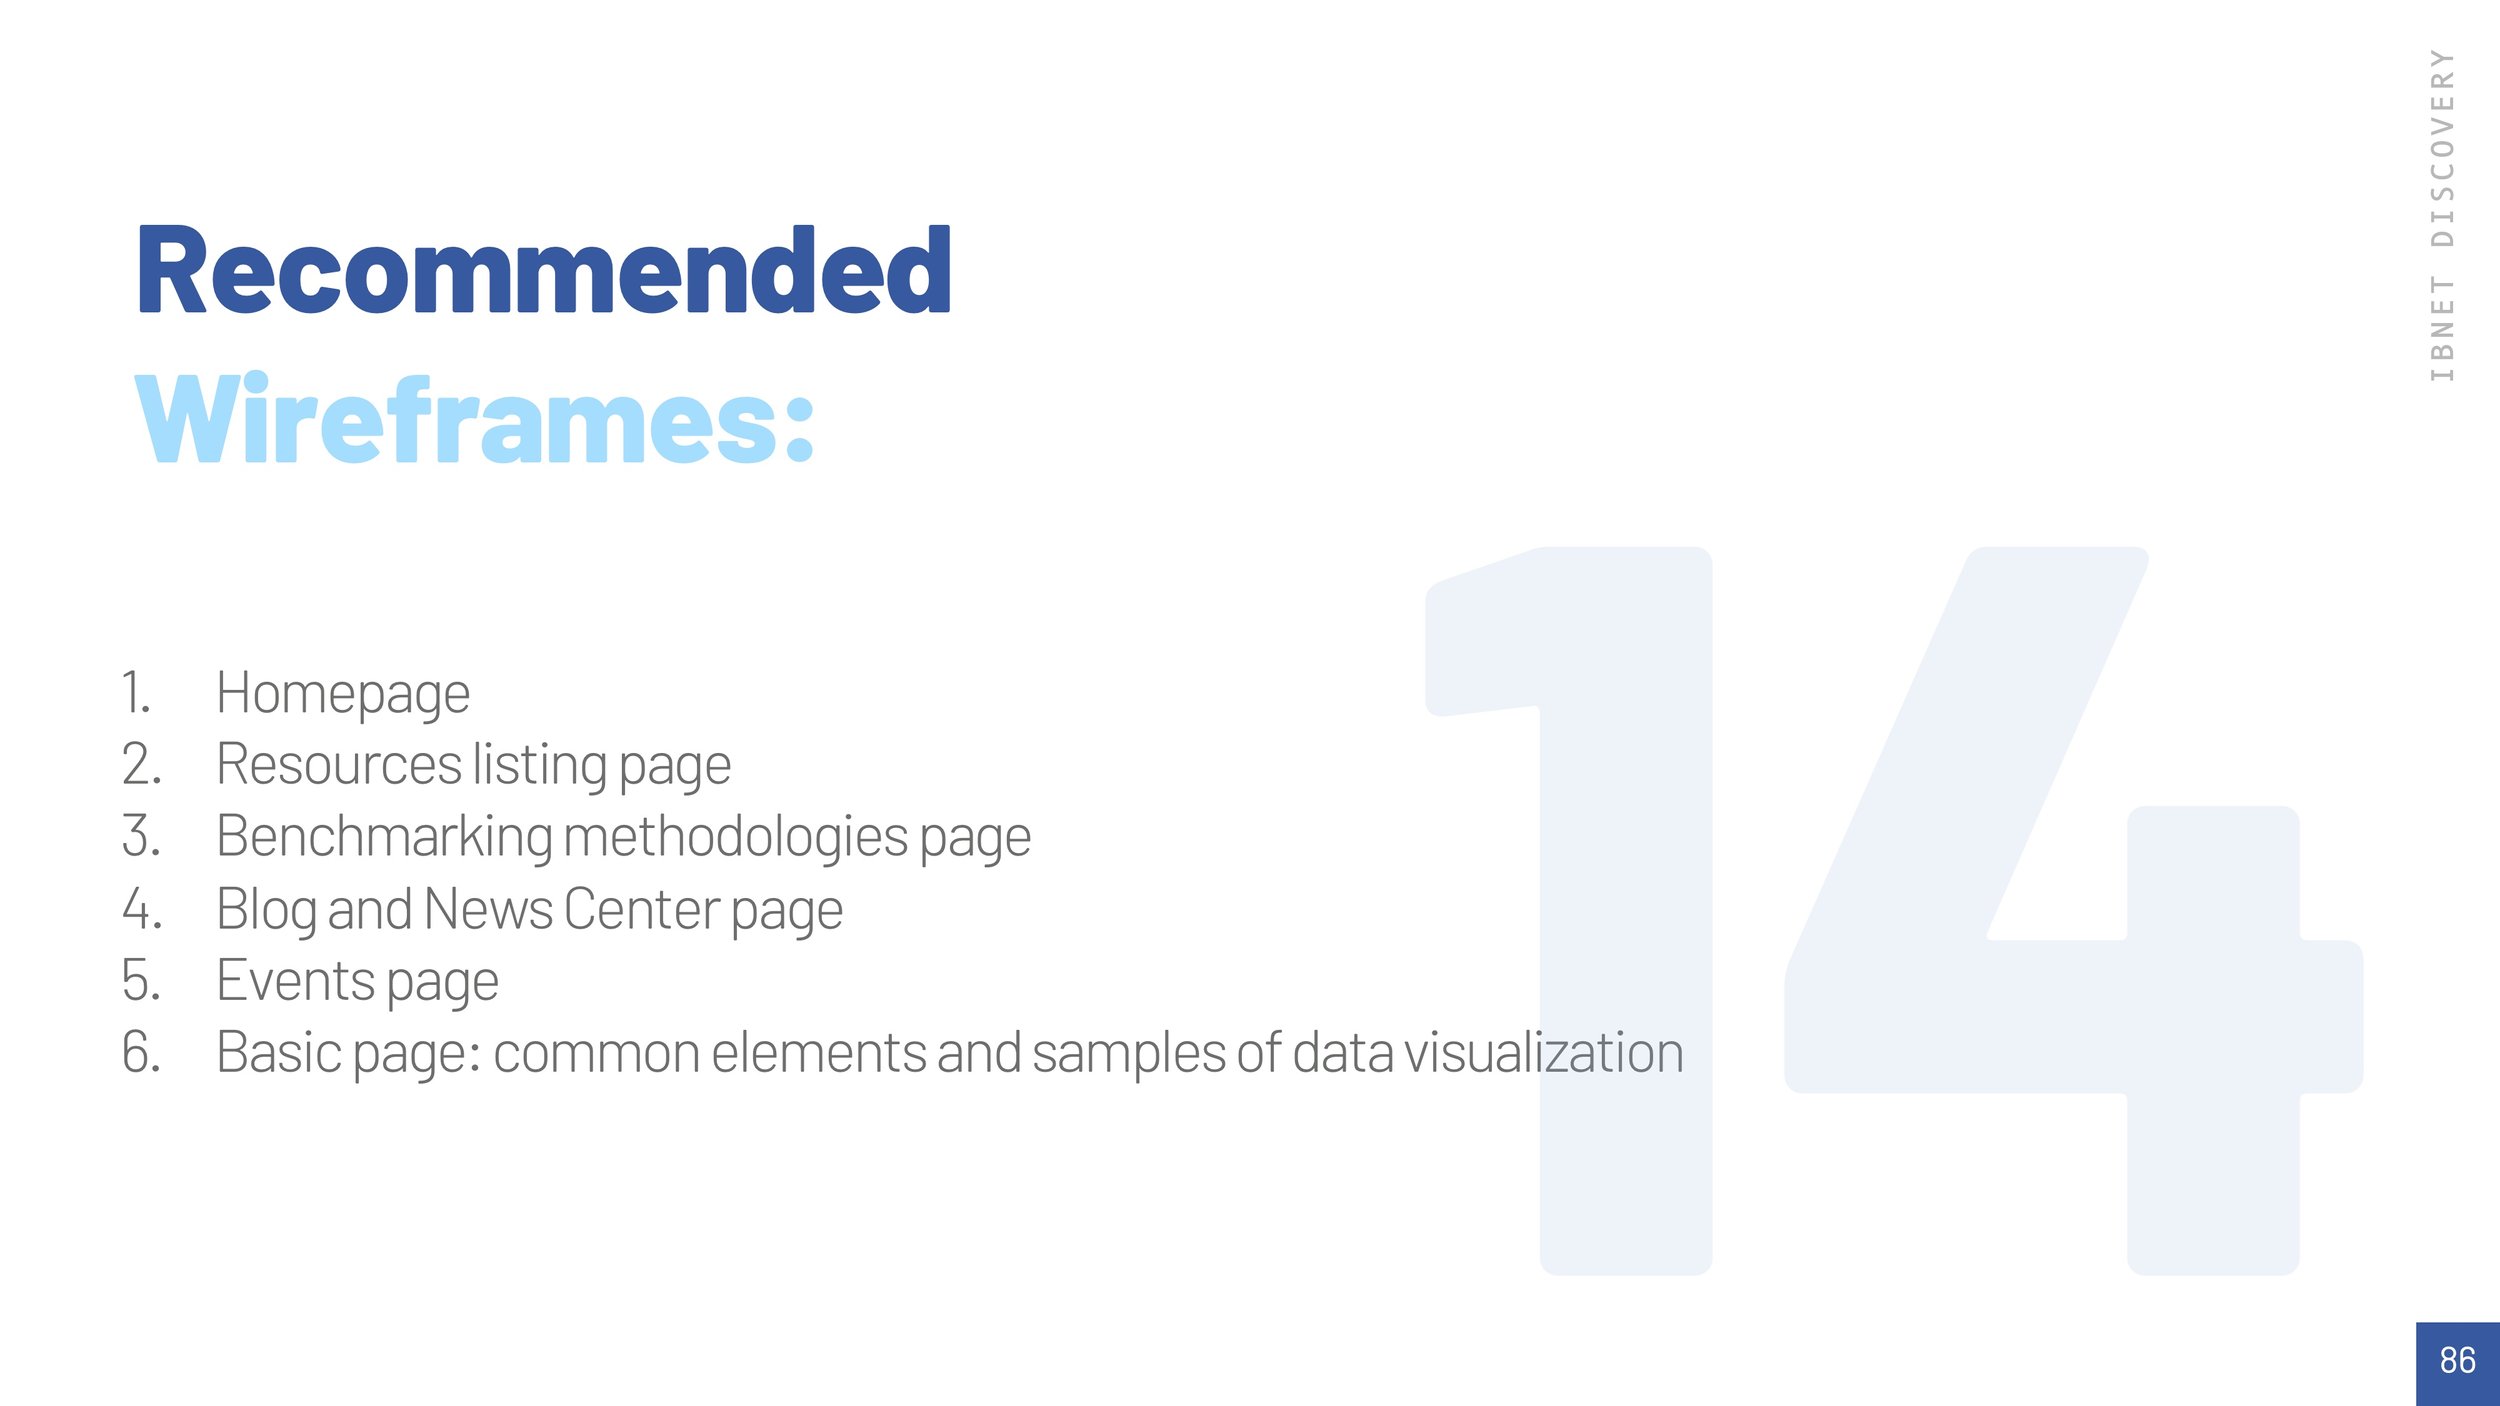
Wireframes
I drafted seven wireframes and went through three rounds of presentations and iterations with the IBNET team. It was here that I was able to formulate a strategy to increase engagement, by establishing value for users in IBNET’s services.
In my wireframes I introduced several new concepts to IBNET, focused on streamlining the data upload process and building a community of value for users.

A Homepage that Tells the IBNET Story
I proposed an interactive homepage concept that highlights the new IBNET as a community of data sharing and learning.
From the benefits of membership, to the data visualization components, users are given the full story of the value IBNET offers the water utility and regulation community, in turn promoting membership and data submission.
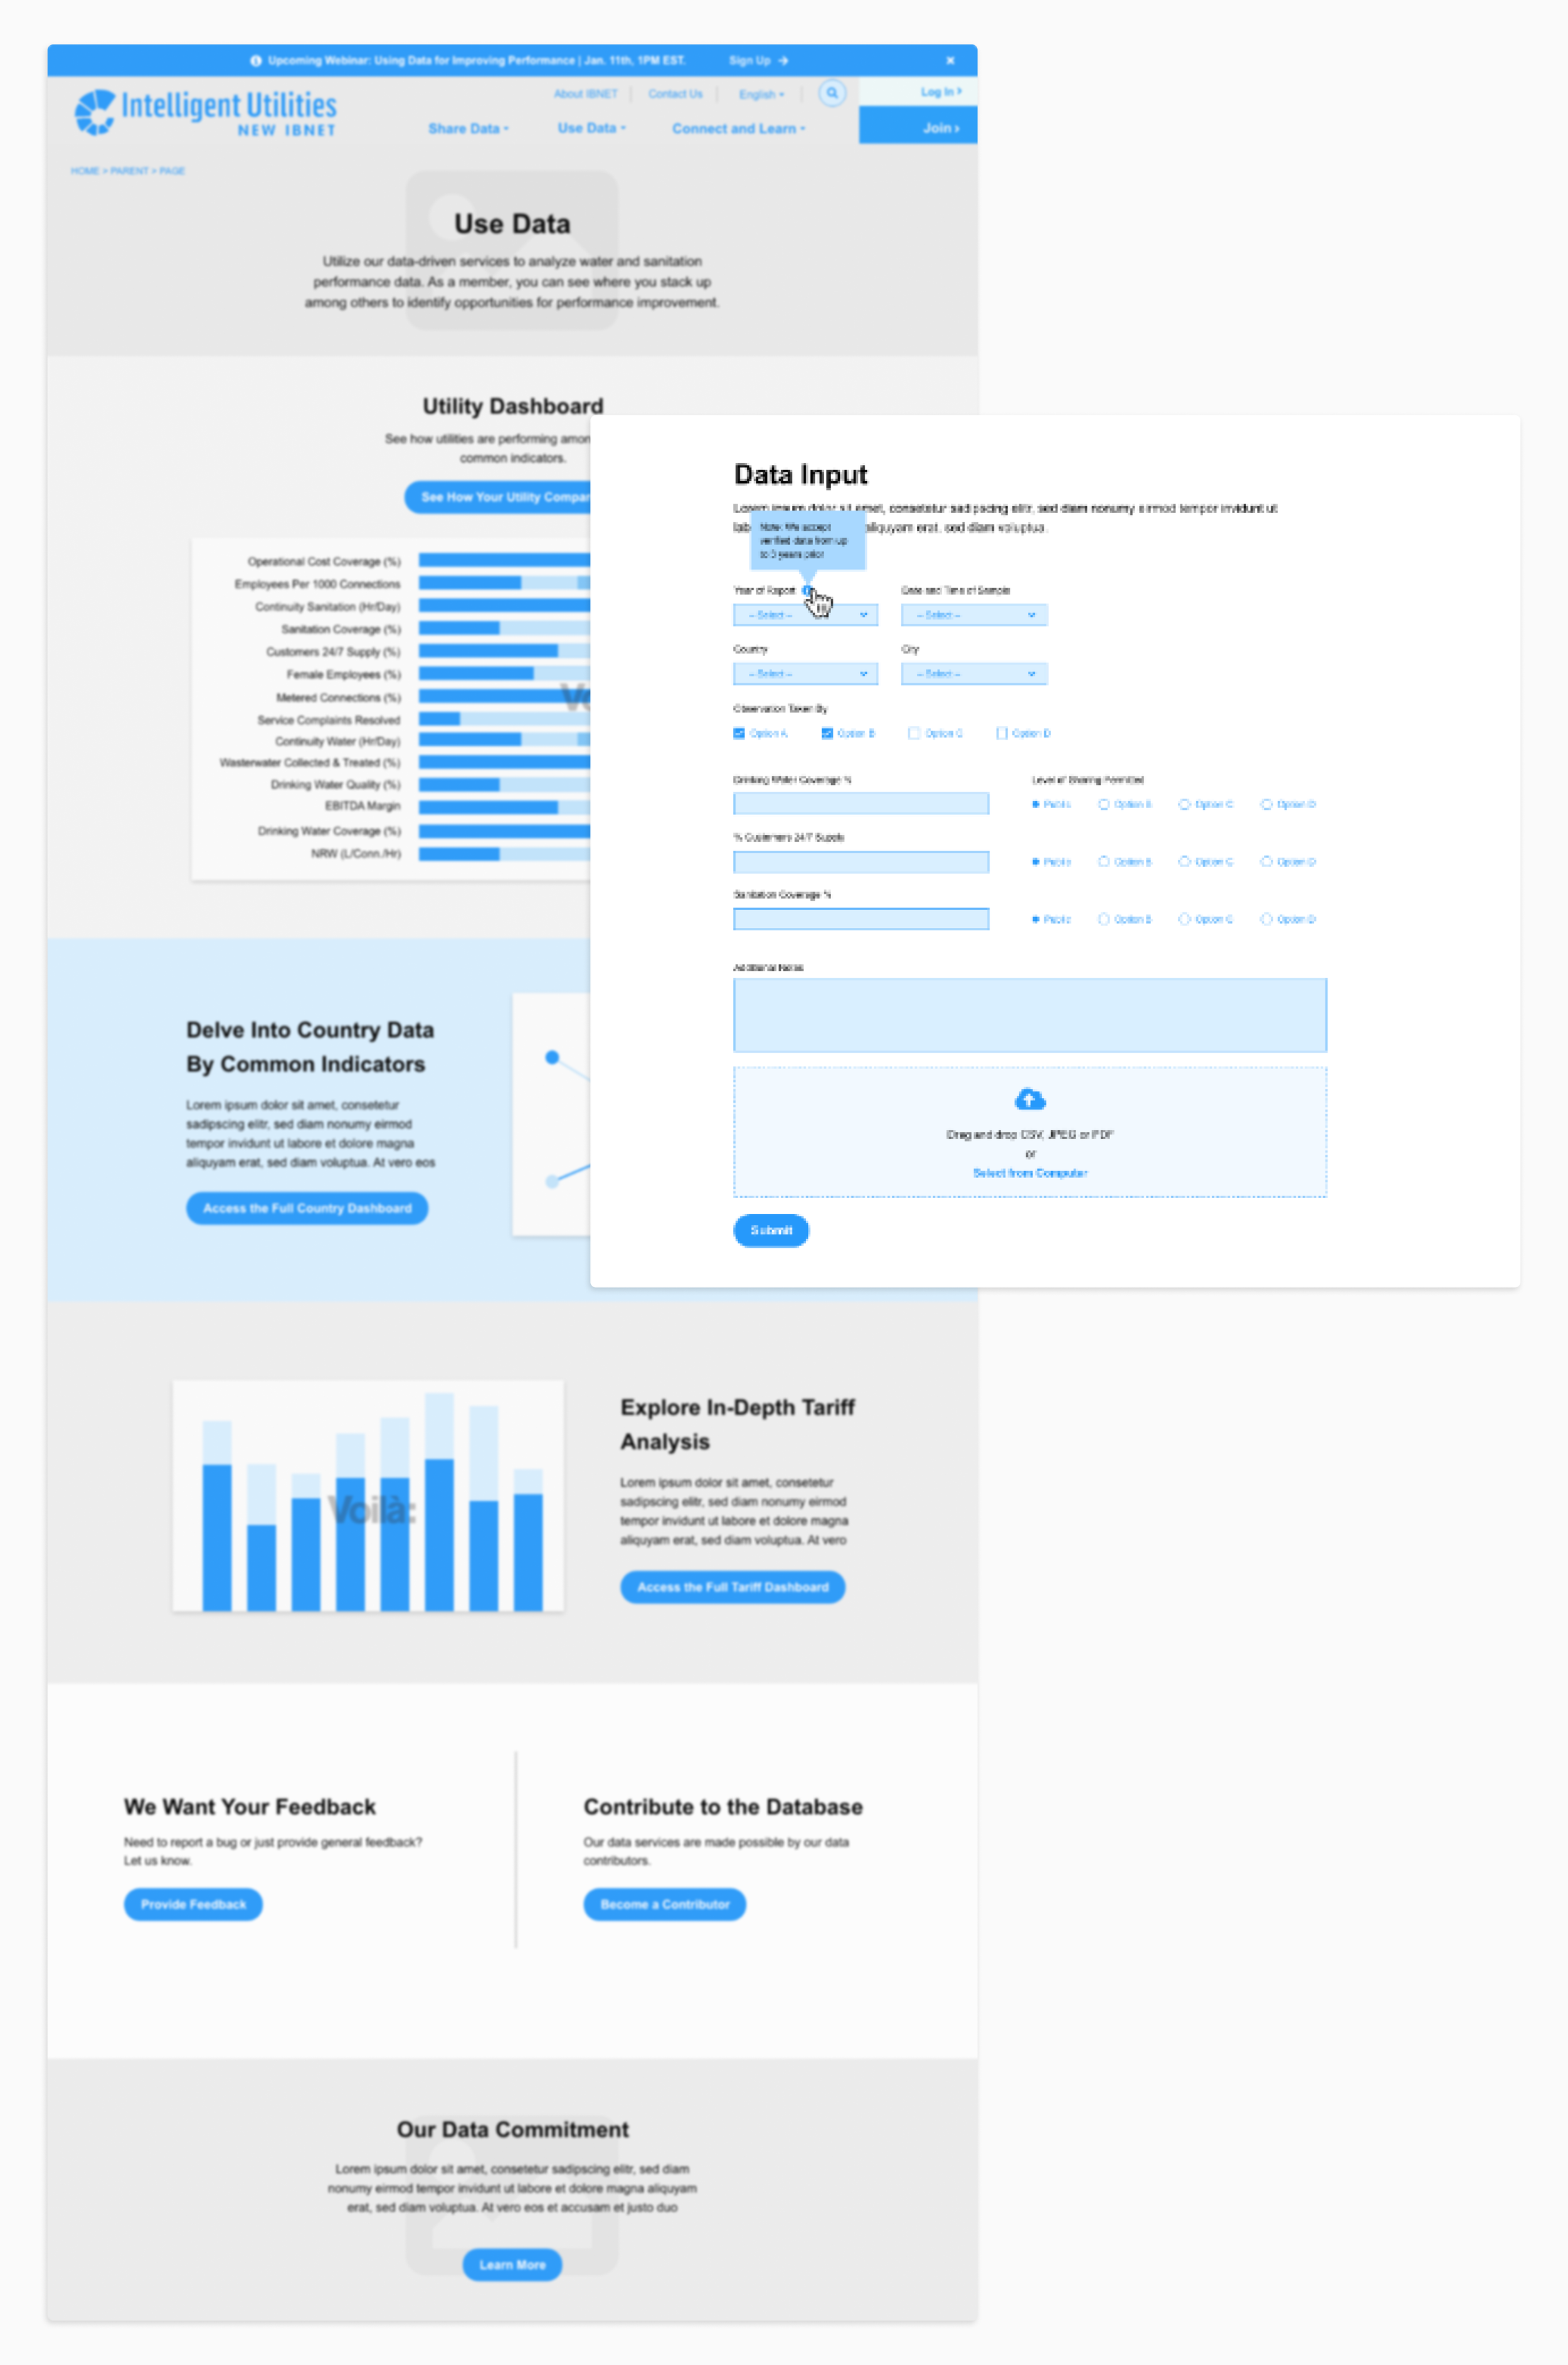
A Refined Data Submission Process
No longer will users have to download spreadsheets to fill in their data for submission- Instead, the data input fields are built seamlessly into the site.
Users are able to explore and analyze IBNET’s vast database directly on their site as well, thanks to Tableau integrations.

A Place to Connect with Other Users
I introduced a member directory feature to IBNET, where water utilities and regulators can come to find one another and connect to share experiences and best practices.

And Learn from Events, News, Resources, and Forums
IBNET is more than just the data it holds. Introducing a space for events, news, resources, and forums allows users to continue learning and improving their practices, creating value for users beyond the data.
Visual Design
I worked with the visual designer to ensure all aspects of the wireframes would be captured in the sites visual design. We met routinely throughout the week and presented the visual designs to the client together.
Data Visualizations:
My team worked with a data science agency to draft Tableau components for the database section of IBNET’s website.
Though it was not in our scope of work, we were able to meet with the data agency team to share my findings and recommendations to influence their data visualization designs.
Handoff
I worked with the Project Manager and Tech Lead to put together a build spec for the redesign, ensuring that all new features, components, and specs were documented. We handed off the designs and specifications to The World Bank Group’s tech team, who will be working on the site’s development. The project is currently in production and will soon go live!